flights |>
  group_by(month) |>
  summarise(n = n()) |>
  remove_missing() |>
ggplot(aes(month, n)) +
  geom_line() +
scale_x_continuous(expand = c(0, NA)) 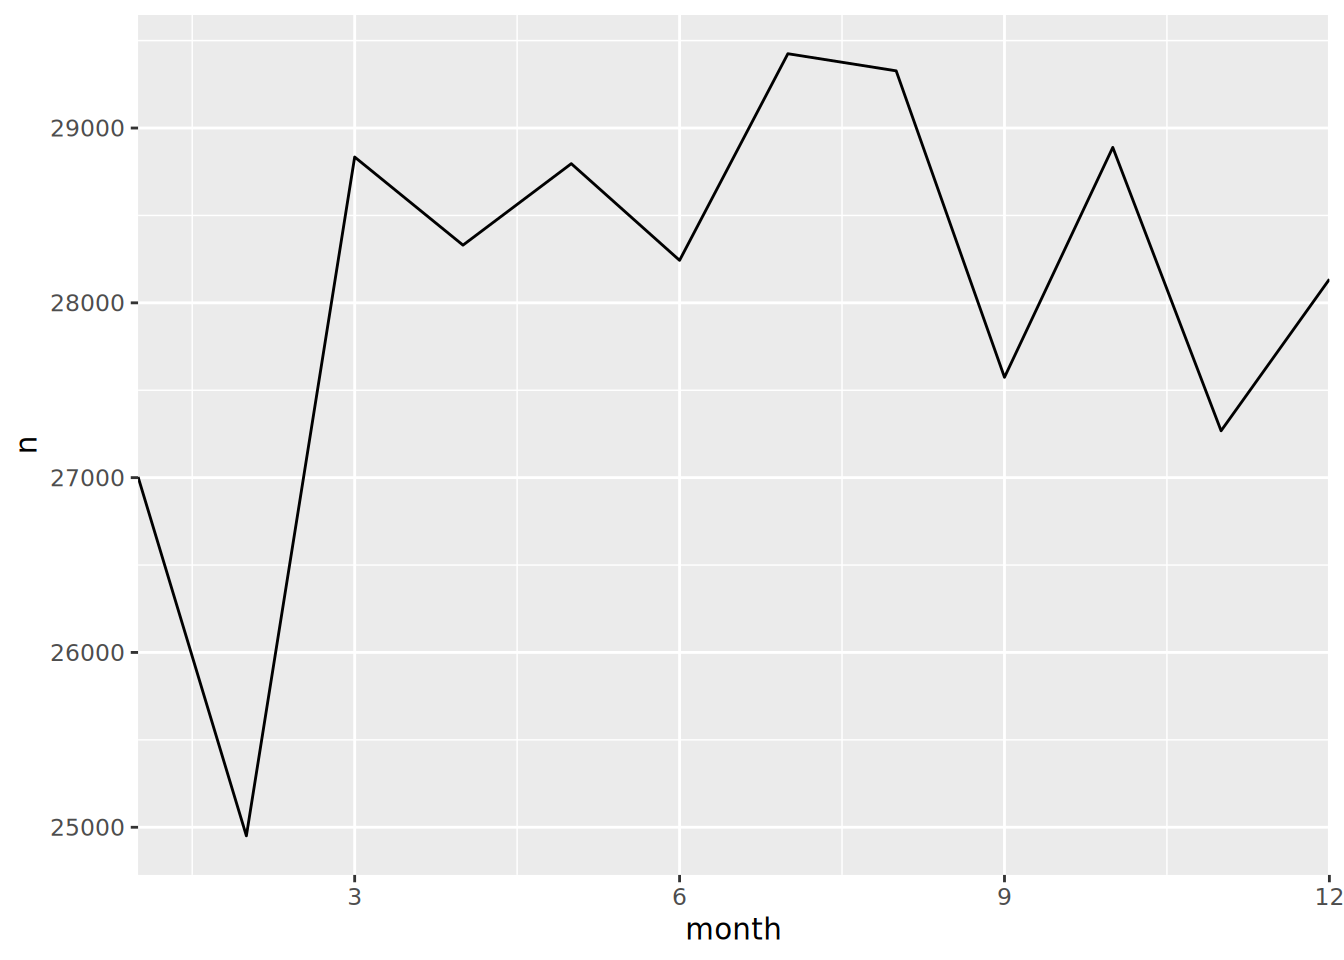
Exercises for Day 2
We will work with the flights data for these exercises. The exercises aim to help you remember the format of functions and test how well you can combine the functions logically. The exercises build in complexity.
Remind yourself what the flights data looks like (column names, dimensions, a general summary of the flights object).
Return only the first 10 flights, showing the carrier, flight number, and distance flown.
gain, which is the arrival delay - departure delaydelay_category variable“on time” (delay ≤ 0), “minor” (0-30), “moderate” (30-60), “severe” (>60)
Create a speed variable (distance/air_time * 60) and arrange accordingly.
flights |>
group_by(month) |>
summarise(n = n()) |>
remove_missing() |>
ggplot(aes(month, n)) +
geom_line() +
scale_x_continuous(expand = c(0, NA))