flights$carrier |> unique() [1] "UA" "AA" "B6" "DL" "EV" "MQ" "US" "WN" "VX" "FL" "AS" "9E" "F9" "HA" "YV"
[16] "OO"Exercises for Day 1
This project will be used for this the exercise only. Give it a name to reflect this. Remember the conventions for naming style.
I strongly recommend not using an LLM for this exercise. Figuring this out on your own is one of the most critical lessons for the day.
Download this template to the project folder.
For this exercise we will need two packages: tidyverse and nycflights13. Load the two packages. What is different between loading tidyverse and nycflights13?
Remember the importance of documentation: use hash symbols to create a section in the .qmd file, use code chunks, document your work.
The nycflights13 package will quietly (in the background, not visible in your Environment) load a data object called “flights”. Use one of the functions we have learned today to view the flights data.
A very common situations you will find yourself in research: You get some data - you don’t know what format it is, what it’s meant to look like, you don’t yet know what questions you can ask of this data.
Use functions we have encountered today to answer the following questions:
flights?How would you measure data in a table?
Look at the column names of the data (colnames()). What do dep_time, arr_time, and air_time mean? With these three variables we can carry out a simple but important test - can you identify what that test is?
dep_time and arr_time.
Given the data variables in flights, propose two hypotheses that we could test with this dataset.
Instead of passing all the data in an object to a function we can specify a single variable with $. Use flights$variable_name to pass a single variable to a function.
e.g.,
flights$carrier |> unique() [1] "UA" "AA" "B6" "DL" "EV" "MQ" "US" "WN" "VX" "FL" "AS" "9E" "F9" "HA" "YV"
[16] "OO"Use the functions unique() and n_distinct() to answer:
range(), mean(), median() to gauge the level of departure delaysWe will need to add na.rm = TRUE as an argument within range(), mean(), and median().
If we do not pass na.rm = TRUEas an argument the functions will detect the presence of NAs in the data and return NA.
ggplotggplot to look at associations between two variables.Here’s a plot to test my hypothesis. Can you identify my hypothesis?
ggplot(flights,
       aes(x = dep_time,
           y = dep_delay)) +
  geom_point()
Warning: Removed 8255 rows containing missing values or values outside the scale range
(`geom_point()`).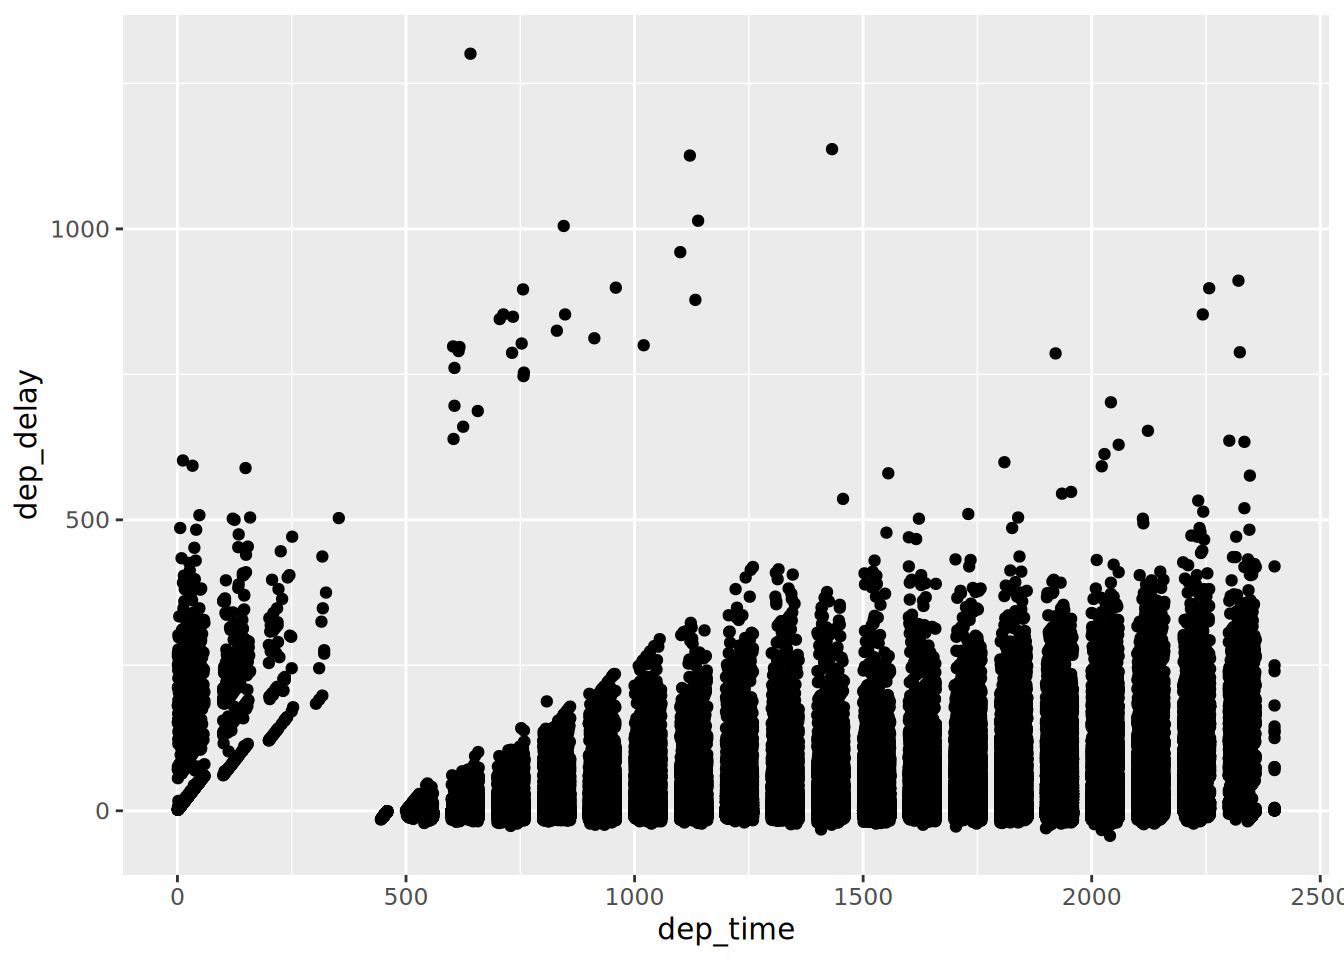
Depending on your choice of variables your plot (and the plot above) may produce a message that looks like this:
Warning: Removed 8255 rows containing missing values or values outside the scale range
(`geom_point()`).What type of message is this? What does this message mean? What steps, if any, do you recommend taking in response?