Plotting penguins

ggplot1

Author
Affiliation

Roland Krause

MADS6

Published

November 5, 2024

Note

This practical aims at performing exploratory plots and how-to build layer by layer to be familiar with the grammar of graphics.

Scatter plots of penguins

The penguins dataset is provided by the palmerpenguins R package. As for every function, most data-sets shipped with a package contain also a useful help page (?).

If not done already, install the package palmerpenguins and load it.
Solution
# install.packages("palmerpenguins")
Solution
library(palmerpenguins)

Attaching package: 'palmerpenguins'
The following objects are masked from 'package:datasets':

    penguins, penguins_raw
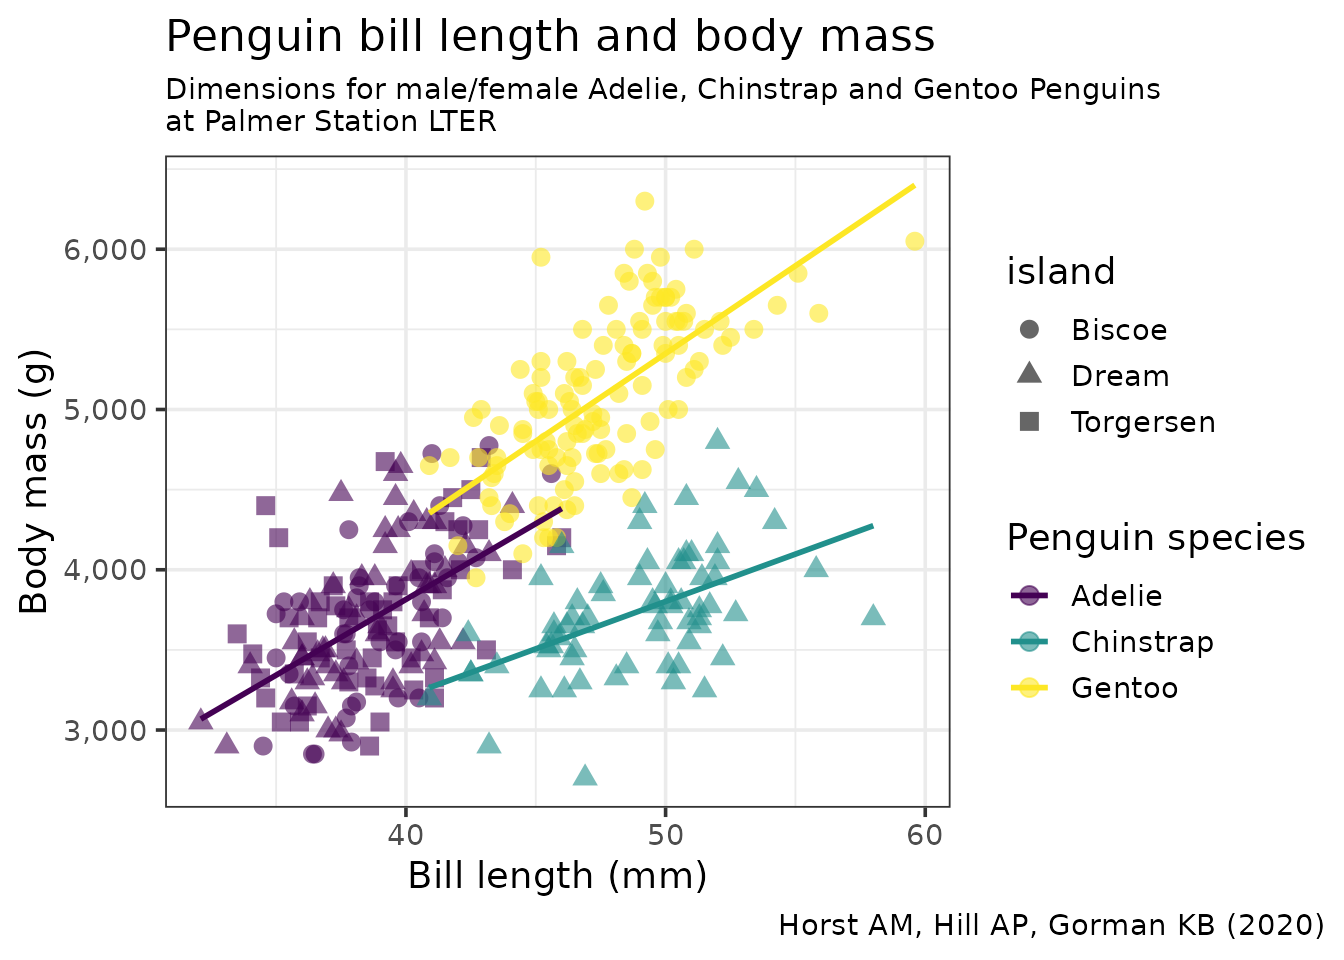
Plot the body mass on the y axis and the bill length on the x axis.
Solution
penguins |>
  ggplot(aes(x = bill_length_mm, 
             y = body_mass_g)) +
  geom_point()
Warning: Removed 2 rows containing missing values or values outside the scale range
(`geom_point()`).

Plot again the body mass on the y axis and the bill length on the x axis, but with colour by species
penguins |>
  ggplot(aes(x = bill_length_mm, 
             y = body_mass_g, 
             colour = species)) +
  geom_point()
Warning: Removed 2 rows containing missing values or values outside the scale range
(`geom_point()`).

The geom_smooth() layer can be used to add a trend line. Try to overlay it to your scatter plot.
Tip

geom_smooth is using a loess regression by default for < 1,000 points and adds standard error intervals.

  • The method argument can be used to change the regression to a linear one: method = "lm"
  • to disable the ribbon of standard errors, set se = FALSE

Be careful where the aesthetics are located, so the trend linear lines are also colored per species.

Solution
penguins |>
  ggplot(aes(x = bill_length_mm, 
             y = body_mass_g, 
             colour = species)) +
  geom_point() +
  geom_smooth(method = "lm", se = FALSE)
`geom_smooth()` using formula = 'y ~ x'
Warning: Removed 2 rows containing non-finite outside the scale range
(`stat_smooth()`).
Warning: Removed 2 rows containing missing values or values outside the scale range
(`geom_point()`).

Adjust the aesthetics of point in order to
  • The shape map to the originated island
  • A fixed size of 3
  • A transparency of 40%
Tip

You should still have only 3 coloured linear trend lines. Otherwise check to which layer your are adding the aesthetic shape. Remember that fixed parameters are to be defined outside aes()

Solution
penguins |>
  ggplot(aes(x = bill_length_mm, y = body_mass_g, 
             colour = species)) +
  geom_point(aes(shape = island), size = 3, alpha = 0.6) +
  geom_smooth(method = "lm", se = FALSE)
`geom_smooth()` using formula = 'y ~ x'
Warning: Removed 2 rows containing non-finite outside the scale range
(`stat_smooth()`).
Warning: Removed 2 rows containing missing values or values outside the scale range
(`geom_point()`).

Adjust the colour aesthetic to the ggplot() call to propagate it to both point and regression line.

Try the scale colour viridis for discrete scale (scale_colour_viridis_d()). Try to change the default theme to theme_bw()

Solution
penguins |>
  ggplot(aes(x = bill_length_mm, y = body_mass_g, 
             colour = species)) +
  geom_point(aes(shape = island), size = 3, alpha = 0.6) +
  geom_smooth(method = "lm", se = FALSE) +
  scale_colour_viridis_d() +
  theme_bw()
`geom_smooth()` using formula = 'y ~ x'
Warning: Removed 2 rows containing non-finite outside the scale range
(`stat_smooth()`).
Warning: Removed 2 rows containing missing values or values outside the scale range
(`geom_point()`).

Find a way to produce the following plot:

Solution
penguins |>
  ggplot(aes(x = bill_length_mm, y = body_mass_g, 
             colour = species)) +
  geom_point(aes(shape = island), size = 3, alpha = 0.6) +
  geom_smooth(method = "lm", se = FALSE) +
  scale_colour_viridis_d() +
  theme_bw(14) +
  theme(plot.caption.position = "plot",
        plot.caption = element_text(face = "italic"),
        plot.subtitle = element_text(size = 11)) +
  scale_y_continuous(labels = scales::comma) +
  labs(title = "Penguin bill length and body mass",
       caption = "Horst AM, Hill AP, Gorman KB (2020)",
       subtitle = "Dimensions for male/female Adelie, Chinstrap and Gentoo Penguins\nat Palmer Station LTER",
       x = "Bill length (mm)",
       y = "Body mass (g)",
       color = "Penguin species") 
`geom_smooth()` using formula = 'y ~ x'
Warning: Removed 2 rows containing non-finite outside the scale range
(`stat_smooth()`).
Warning: Removed 2 rows containing missing values or values outside the scale range
(`geom_point()`).

Remember that
  • All aesthetics defined in the ggplot(aes()) command will be inherited by all following layers
  • aes() of individual geoms are specific (and overwrite the global definition if present).
  • labs() controls of plot annotations
  • theme() allows to tweak the plot like theme(plot.caption = element_text(face = "italic")) to render in italic the caption

Exact reproduction

The order of the legend has changed since the versions of ggplot2 used for the creation of the image.

You can set the legend title using the guides function, which allows to set the order with guide_legend( ... order = n)

Solution
penguins |>
  ggplot(aes(x = bill_length_mm, y = body_mass_g, 
             colour = species)) +
  geom_point(aes(shape = island), size = 3, alpha = 0.6) +
  geom_smooth(method = "lm", se = FALSE) +
  scale_colour_viridis_d() +
  theme_bw(14) +
  theme(plot.caption.position = "plot",
        plot.caption = element_text(face = "italic"),
        plot.subtitle = element_text(size = 11)) +
  scale_y_continuous(labels = scales::comma) +
  labs(title = "Penguin bill length and body mass",
       caption = "Horst AM, Hill AP, Gorman KB (2020)",
       subtitle = "Dimensions for male/female Adelie, Chinstrap and Gentoo Penguins\nat Palmer Station LTER",
       x = "Bill length (mm)",
       y = "Body mass (g)") +
  guides(shape = guide_legend(title = "island", order =1 ),     
         color = guide_legend(title = "Penguin species", order = 2)) 
`geom_smooth()` using formula = 'y ~ x'
Warning: Removed 2 rows containing non-finite outside the scale range
(`stat_smooth()`).
Warning: Removed 2 rows containing missing values or values outside the scale range
(`geom_point()`).