Rows: 150
Columns: 6
$ `Question 1` <fct> Strongly disagree, Strongly agree, Strongly disagree, Str…
$ `Question 2` <fct> Disagree, Strongly disagree, Strongly disagree, Strongly …
$ `Question 3` <fct> Agree, Agree, Agree, Strongly agree, Agree, Disagree, Str…
$ `Question 4` <fct> Disagree, Strongly agree, Neither agree nor disagree, Nei…
$ `Question 5` <fct> Strongly agree, Strongly agree, Strongly disagree, Strong…
$ `Question 6` <fct> Strongly disagree, Strongly disagree, Agree, Agree, Stron…Ordinal data
Integer values from limited ranges
Wednesday, 25 March 2026
Worked example
Sample
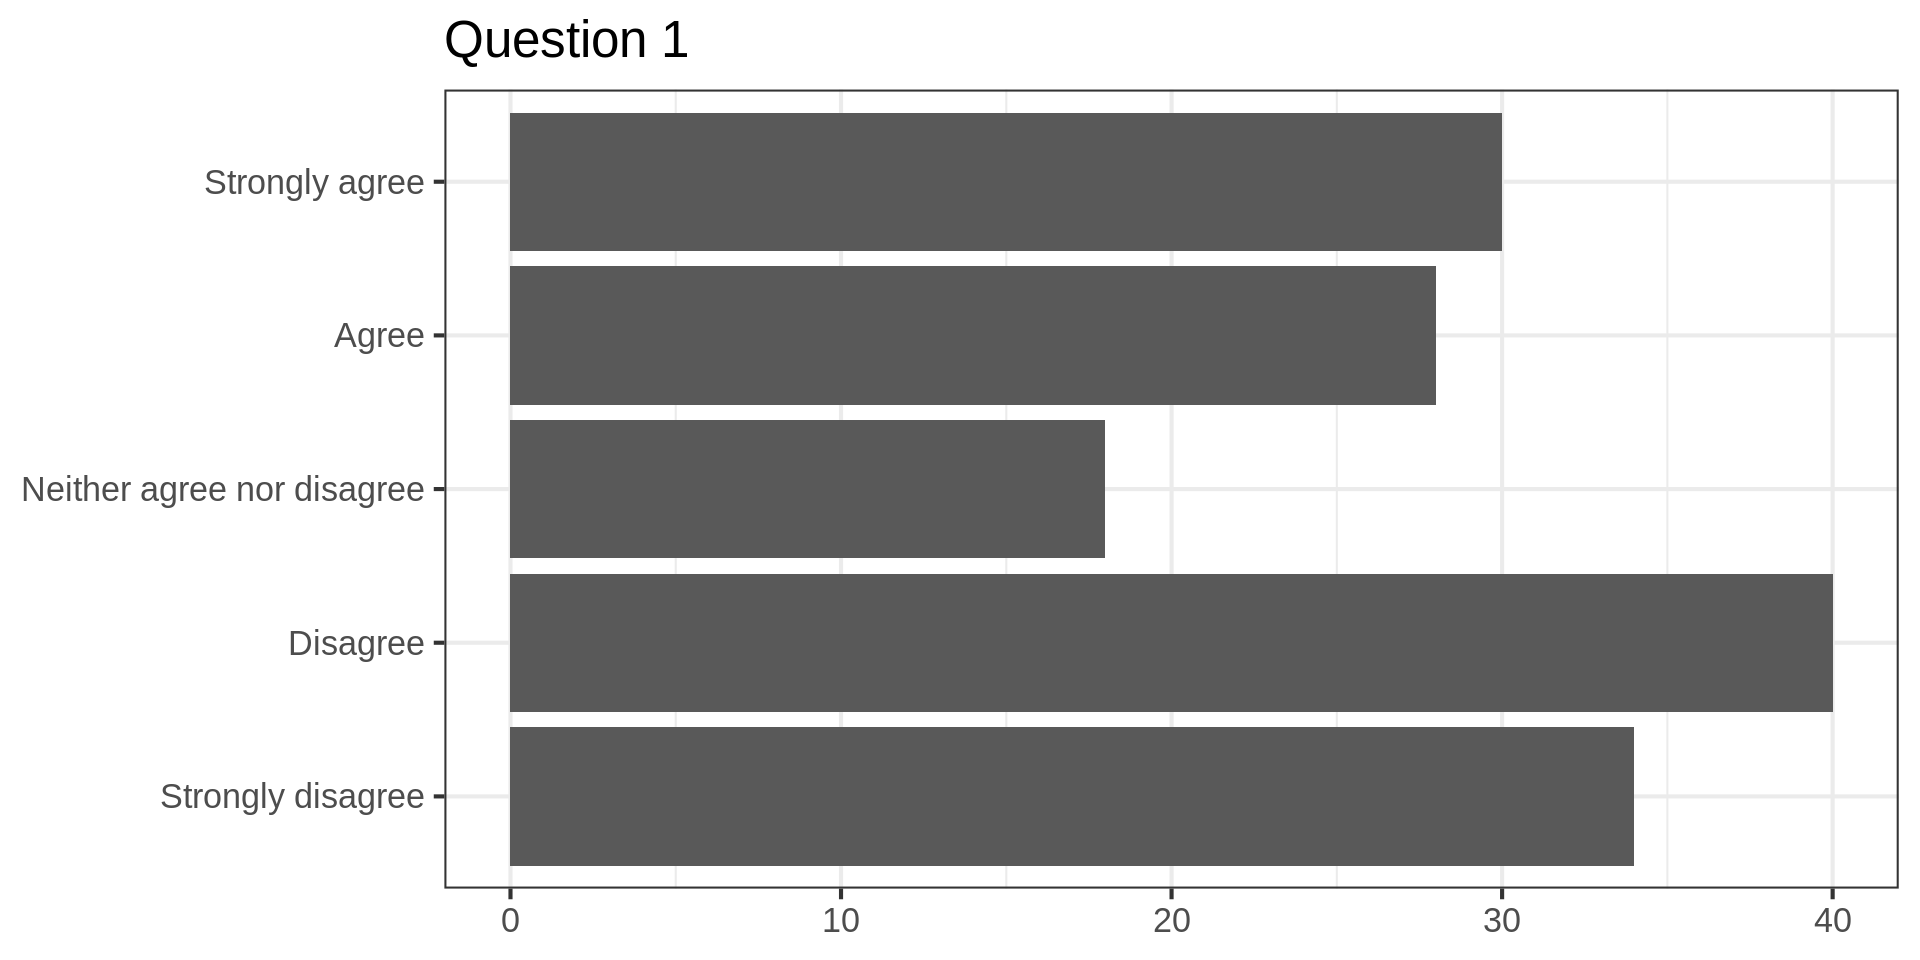
Uninspiring bar chart
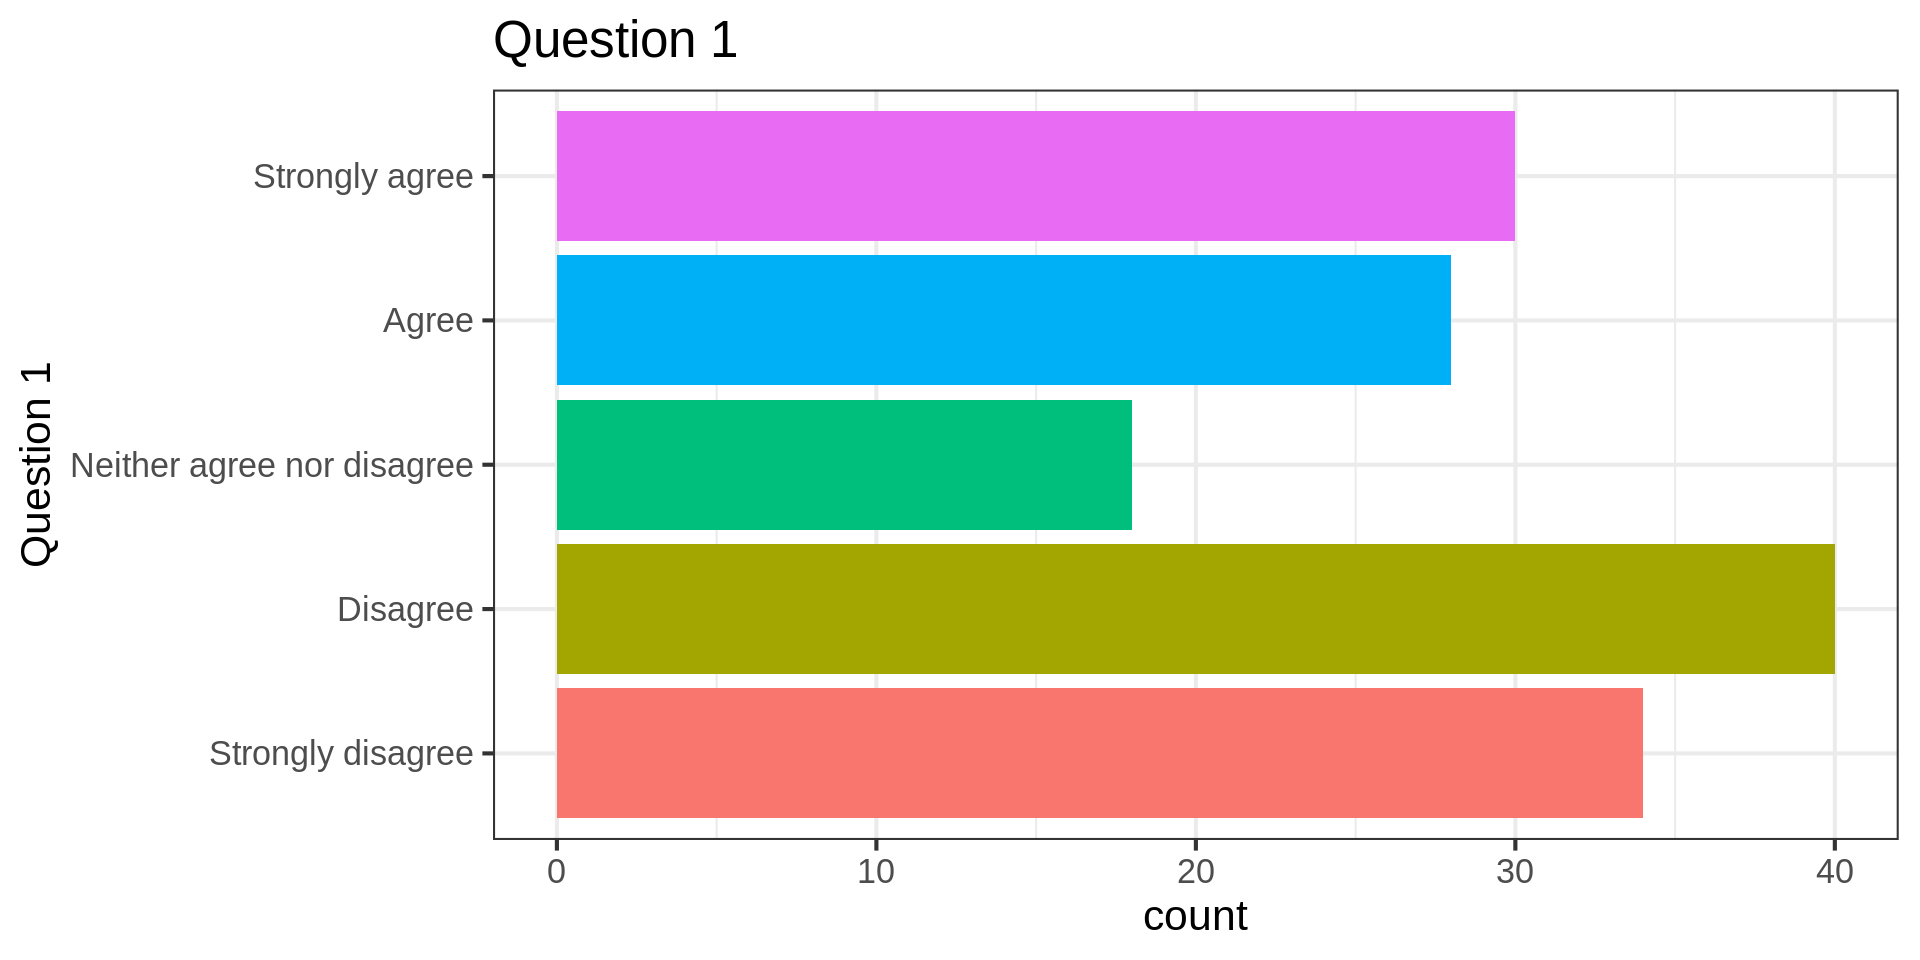
Better barchart
Improved barchart
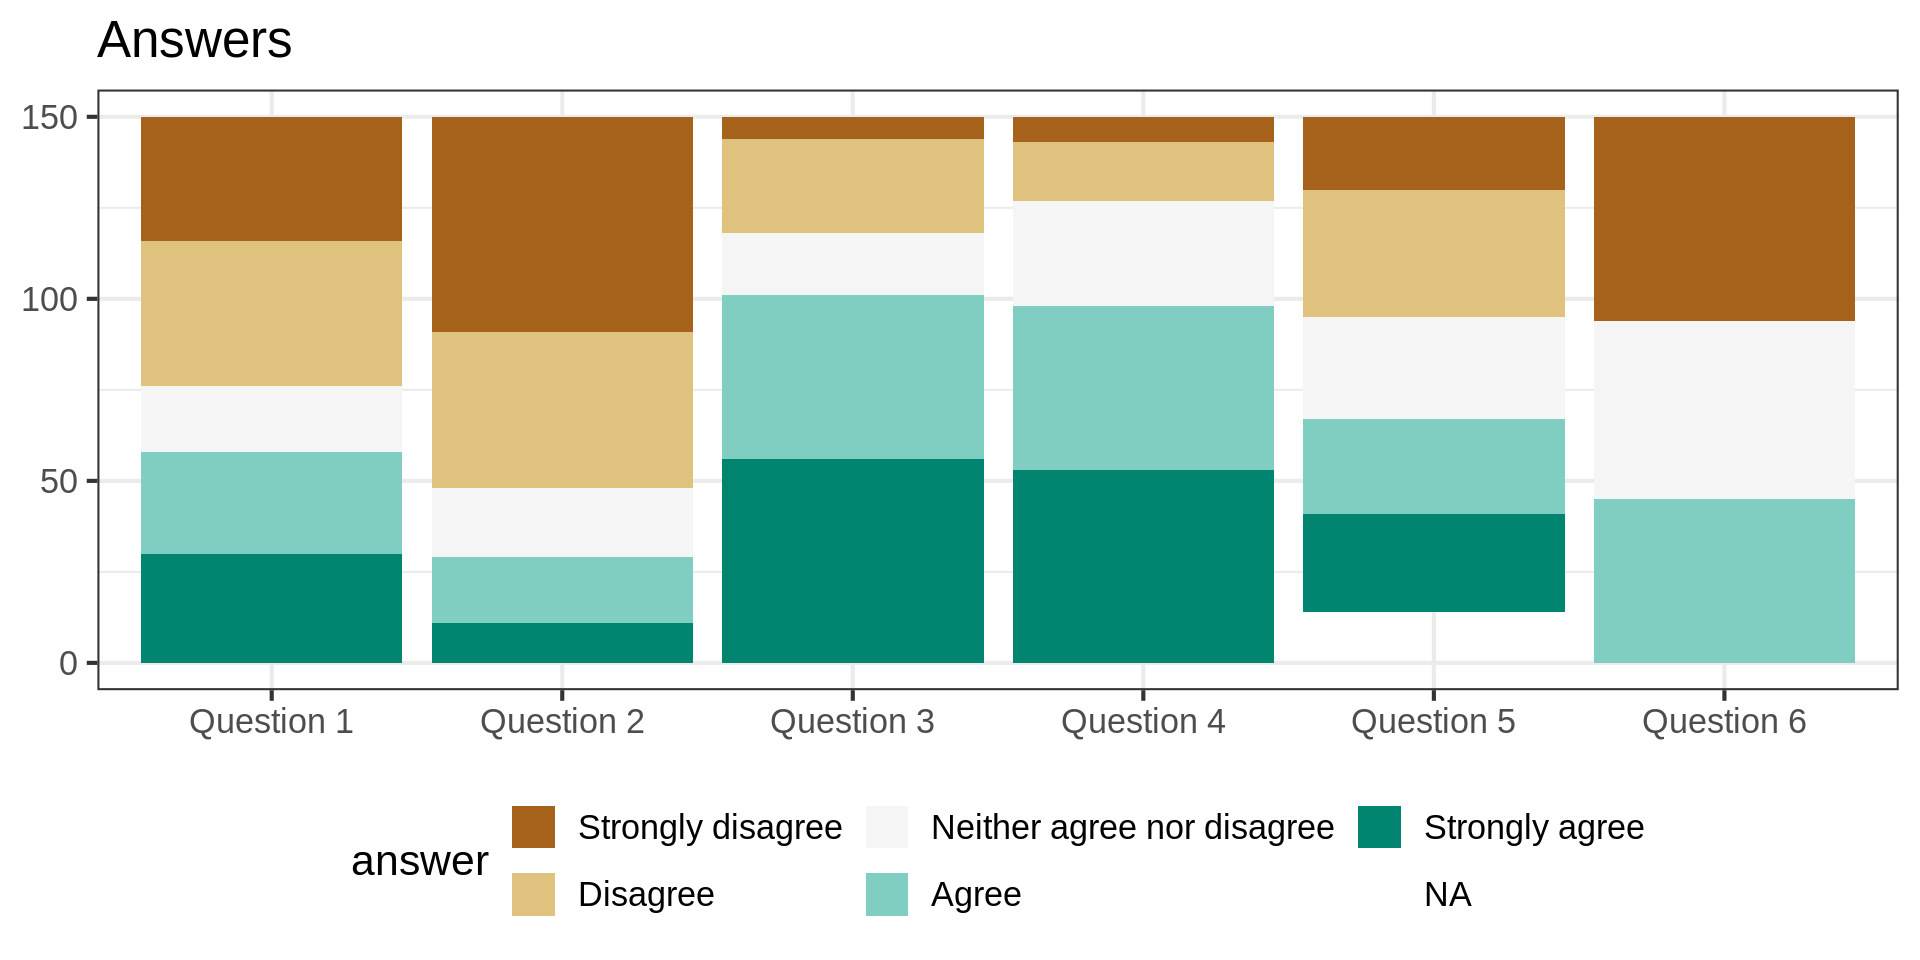
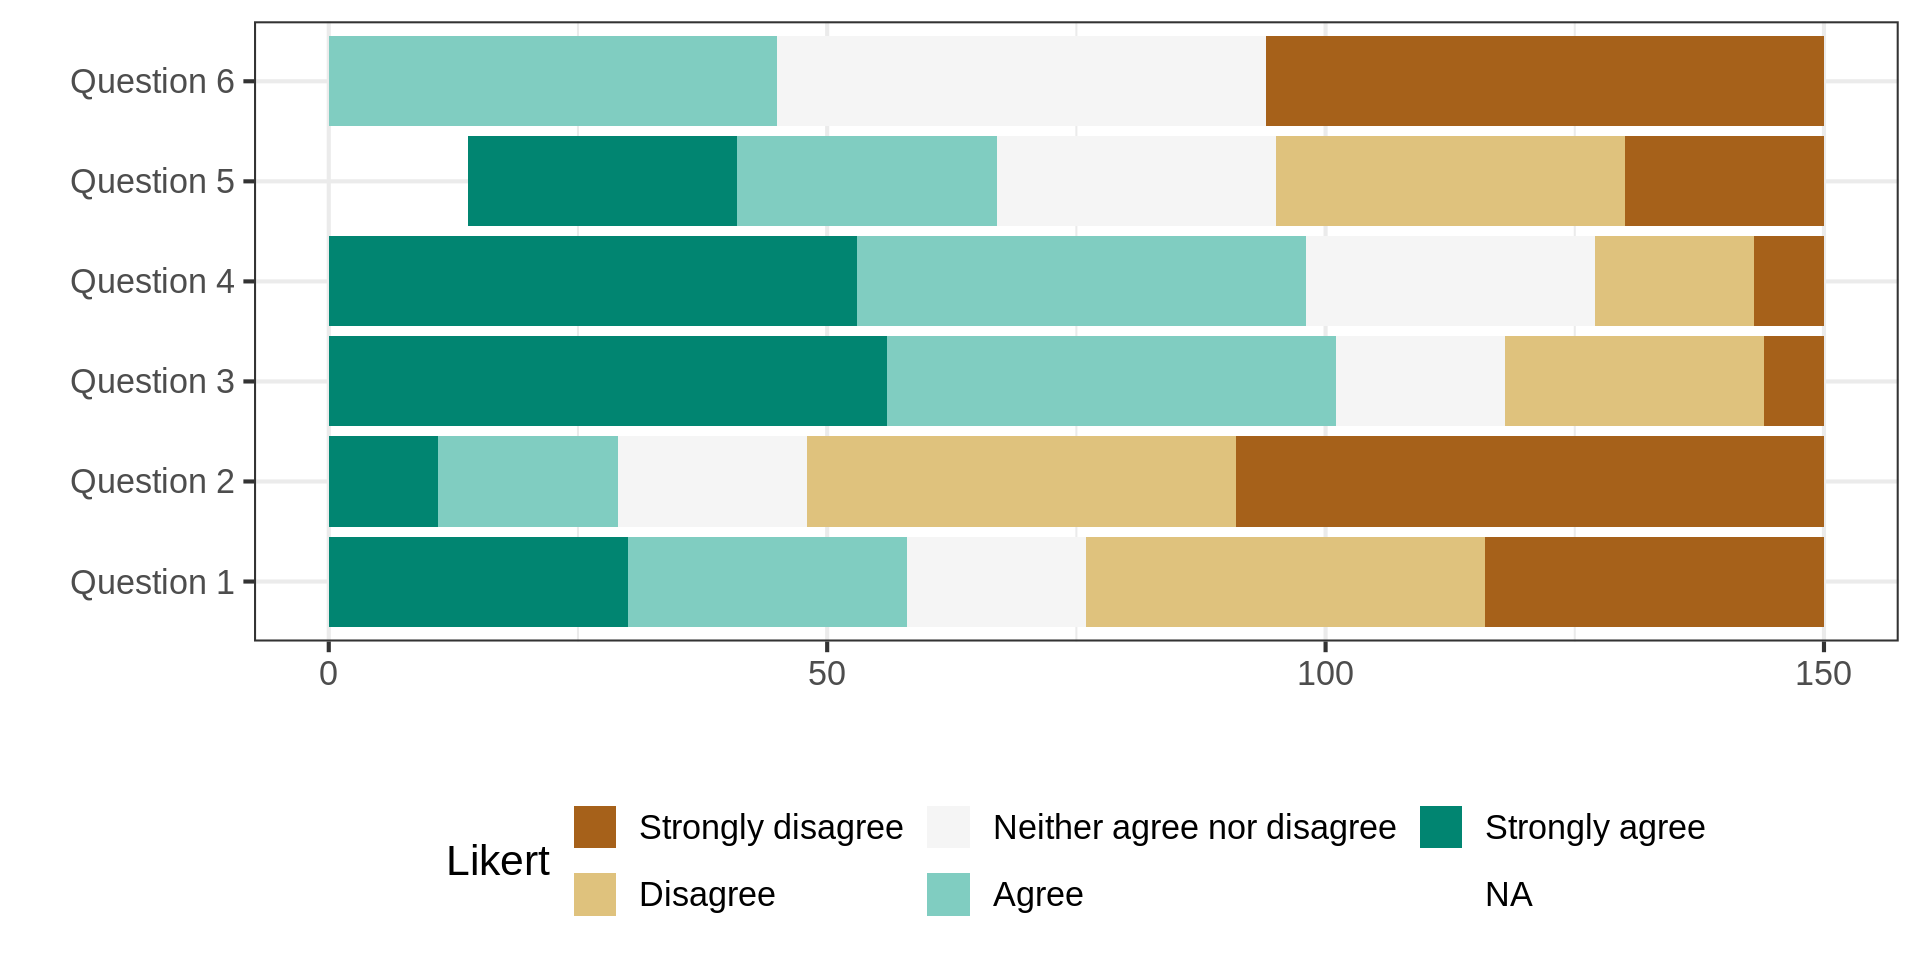
As stacked bar chart - y-x
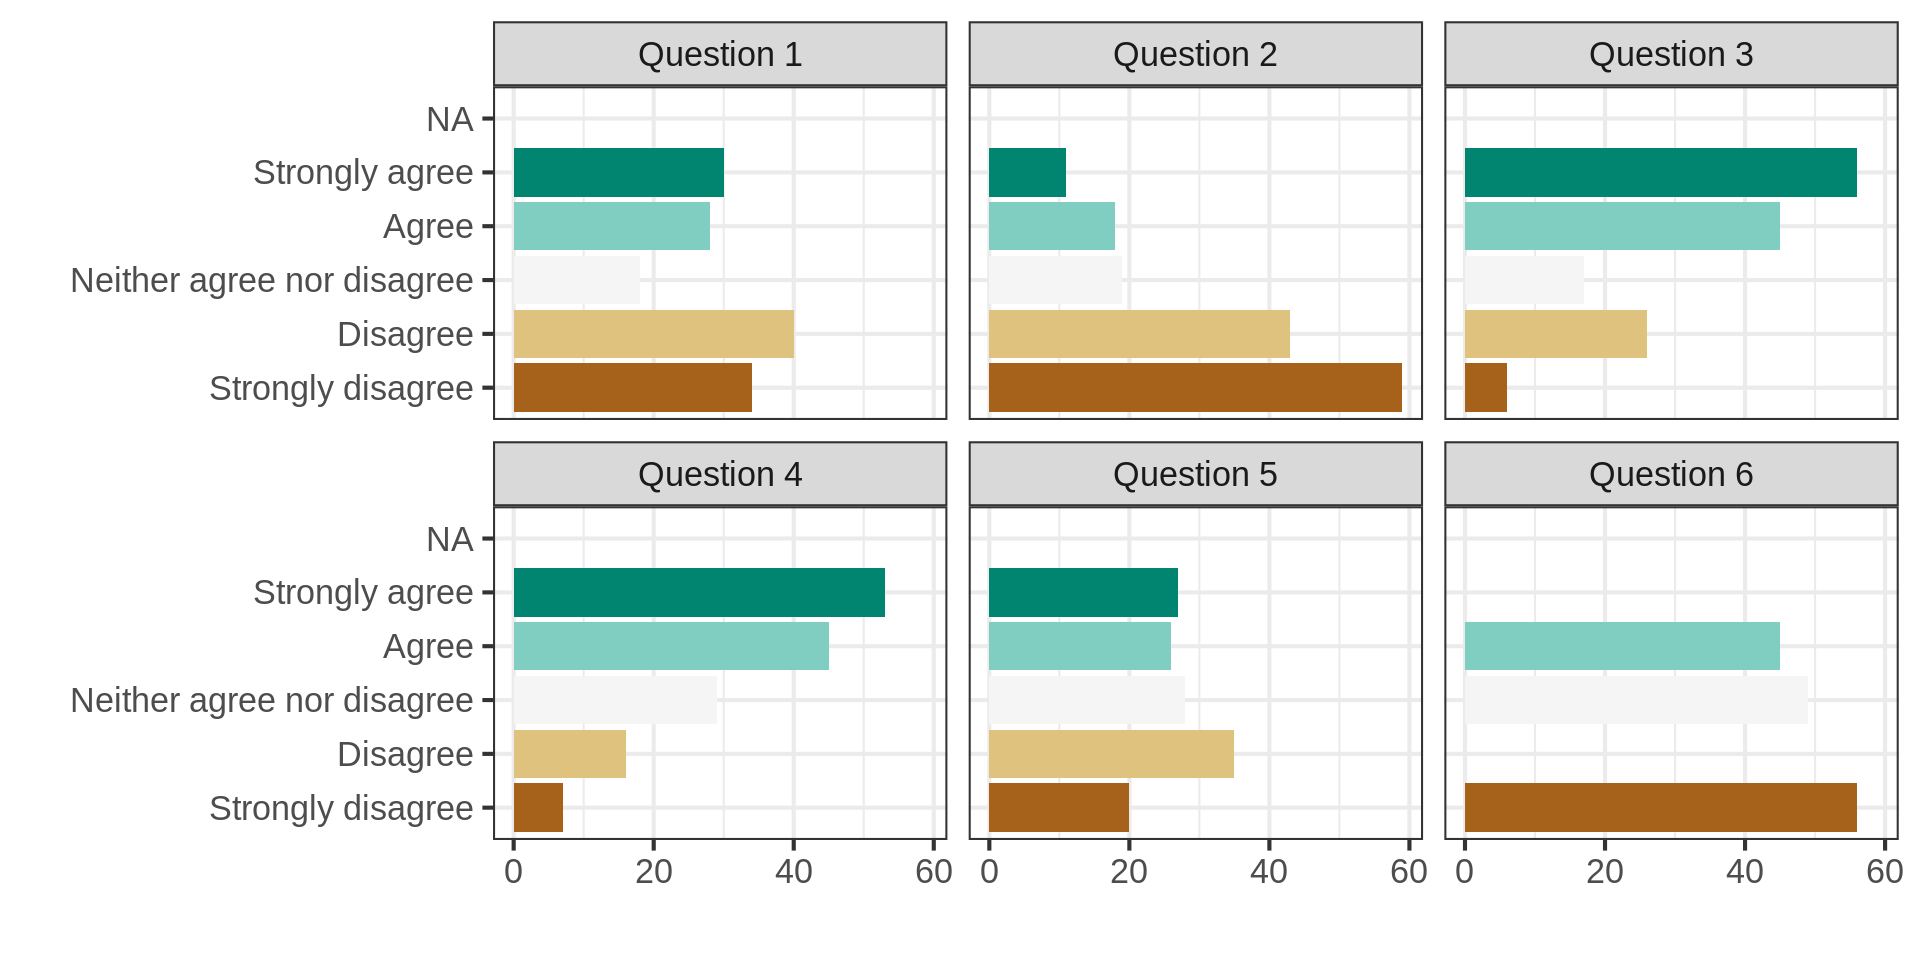
As small multiple
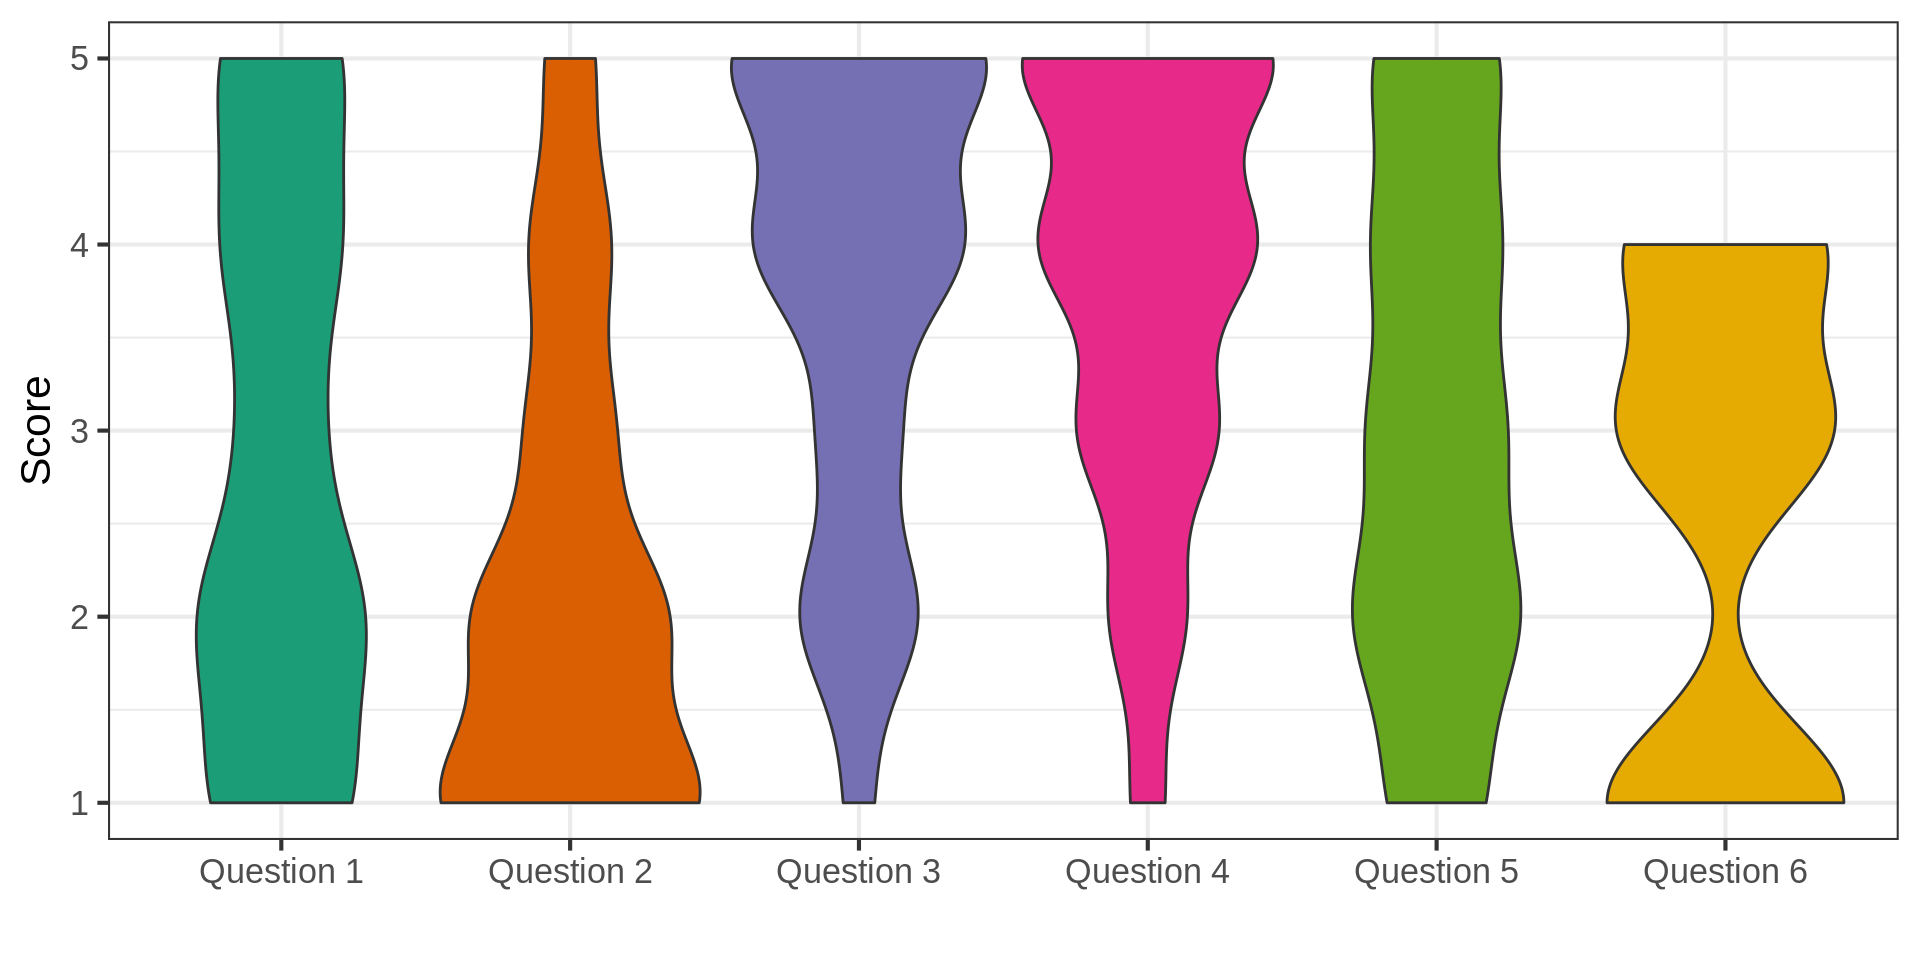
As violin plots
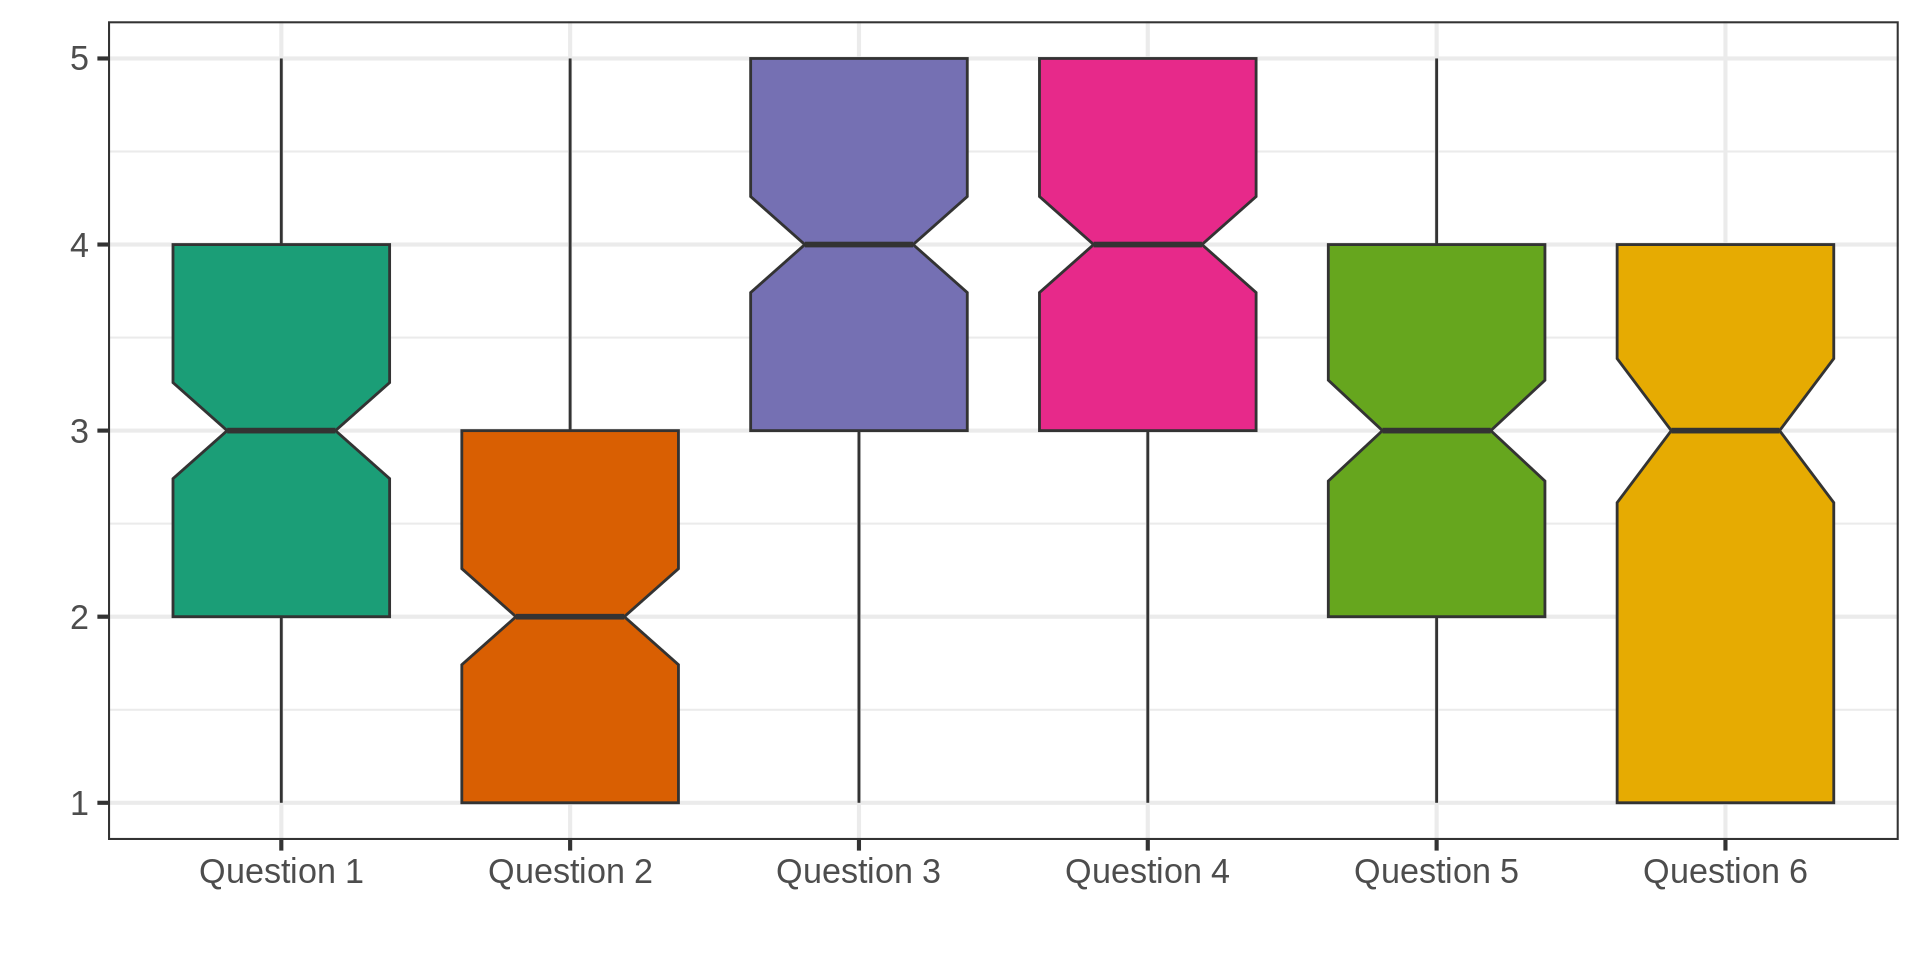
As box plots
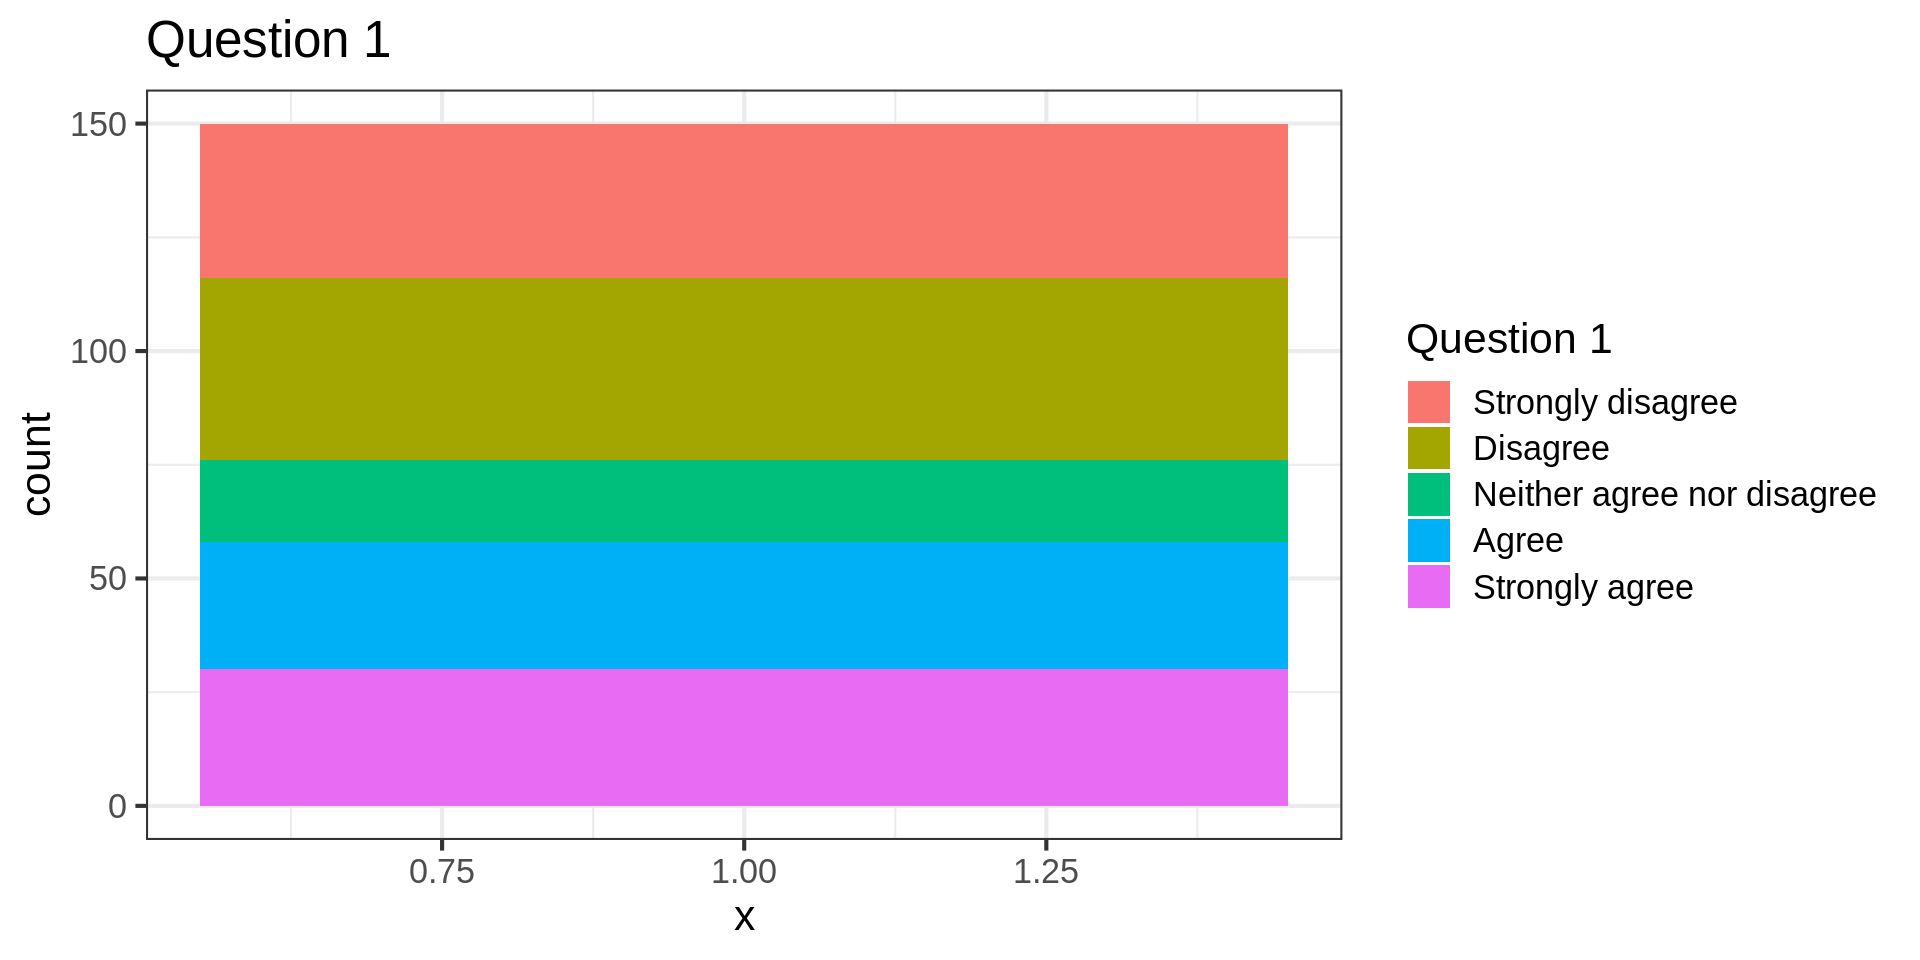
As stacked bar chart
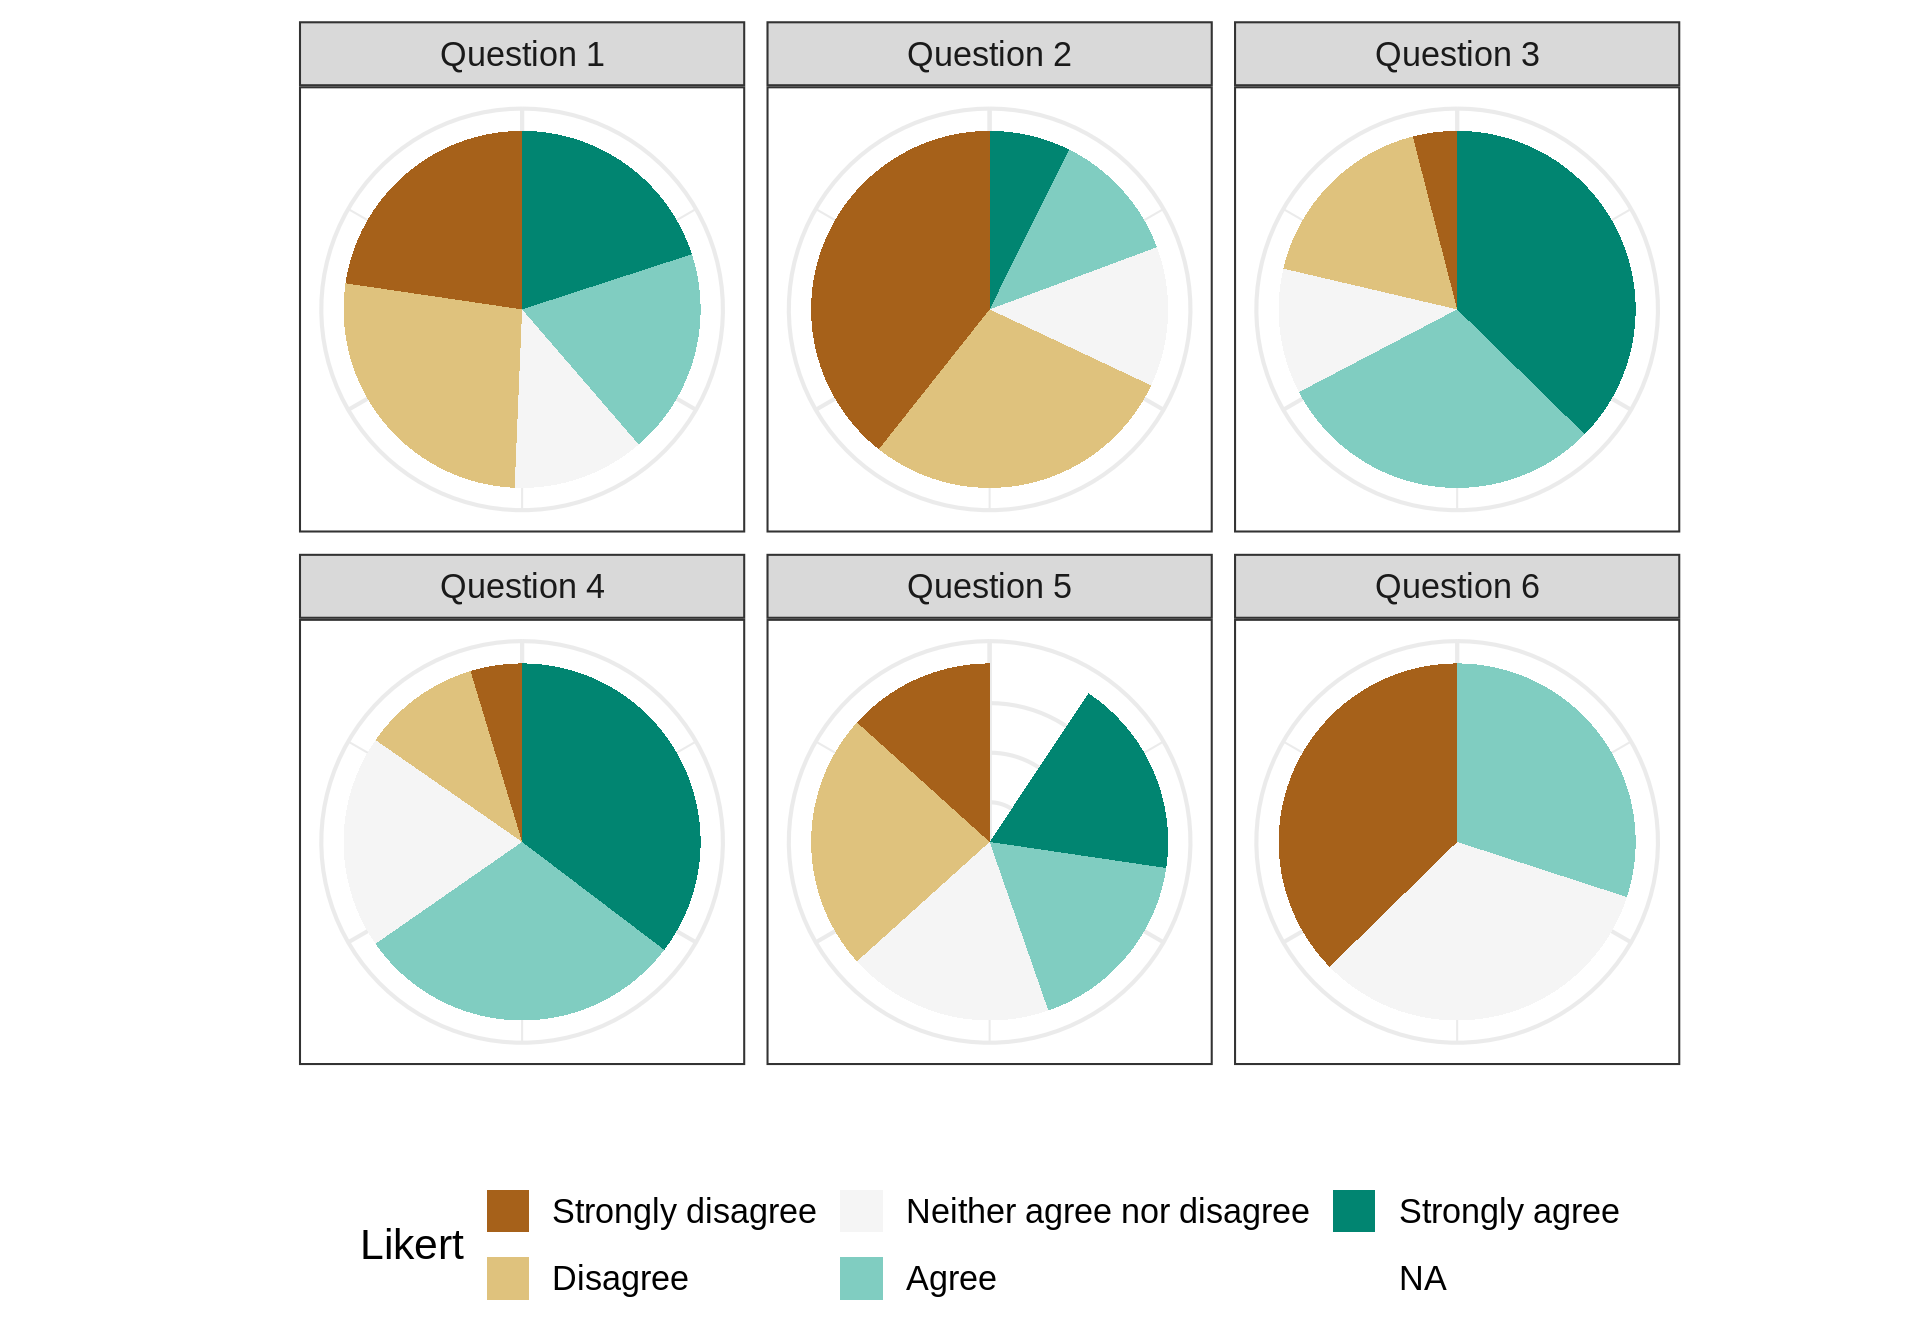
As pie charts
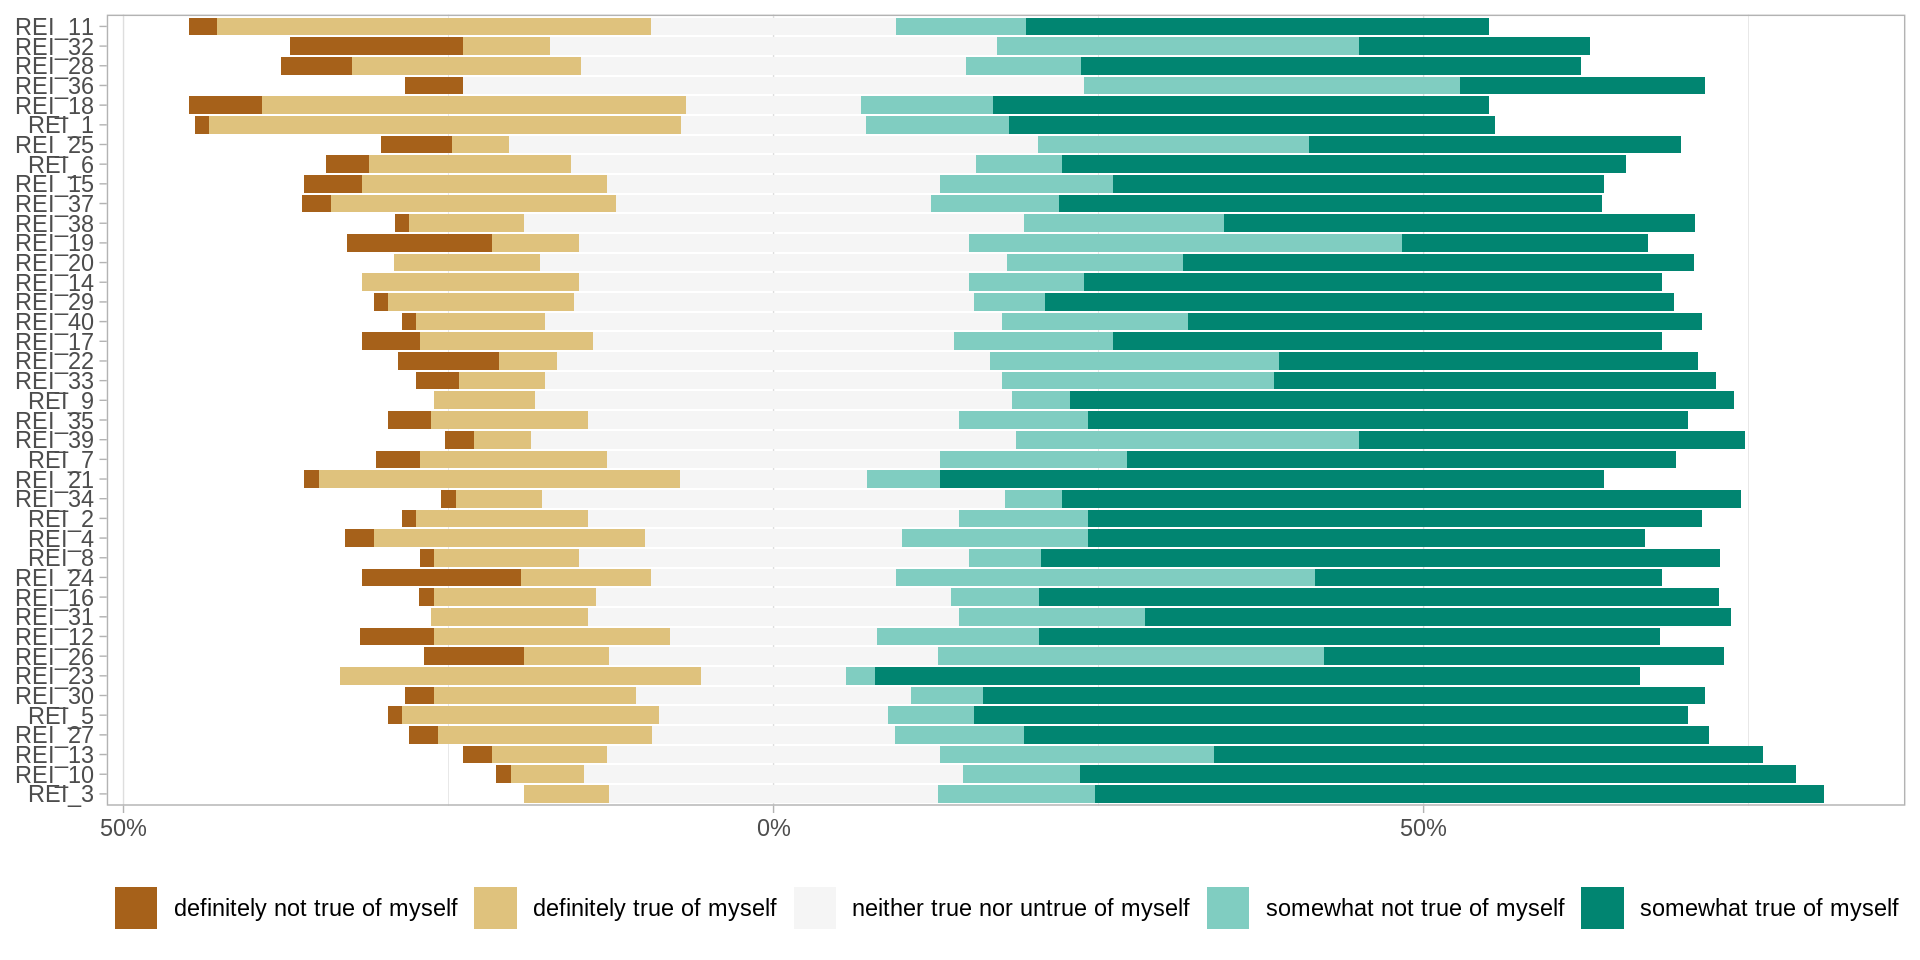
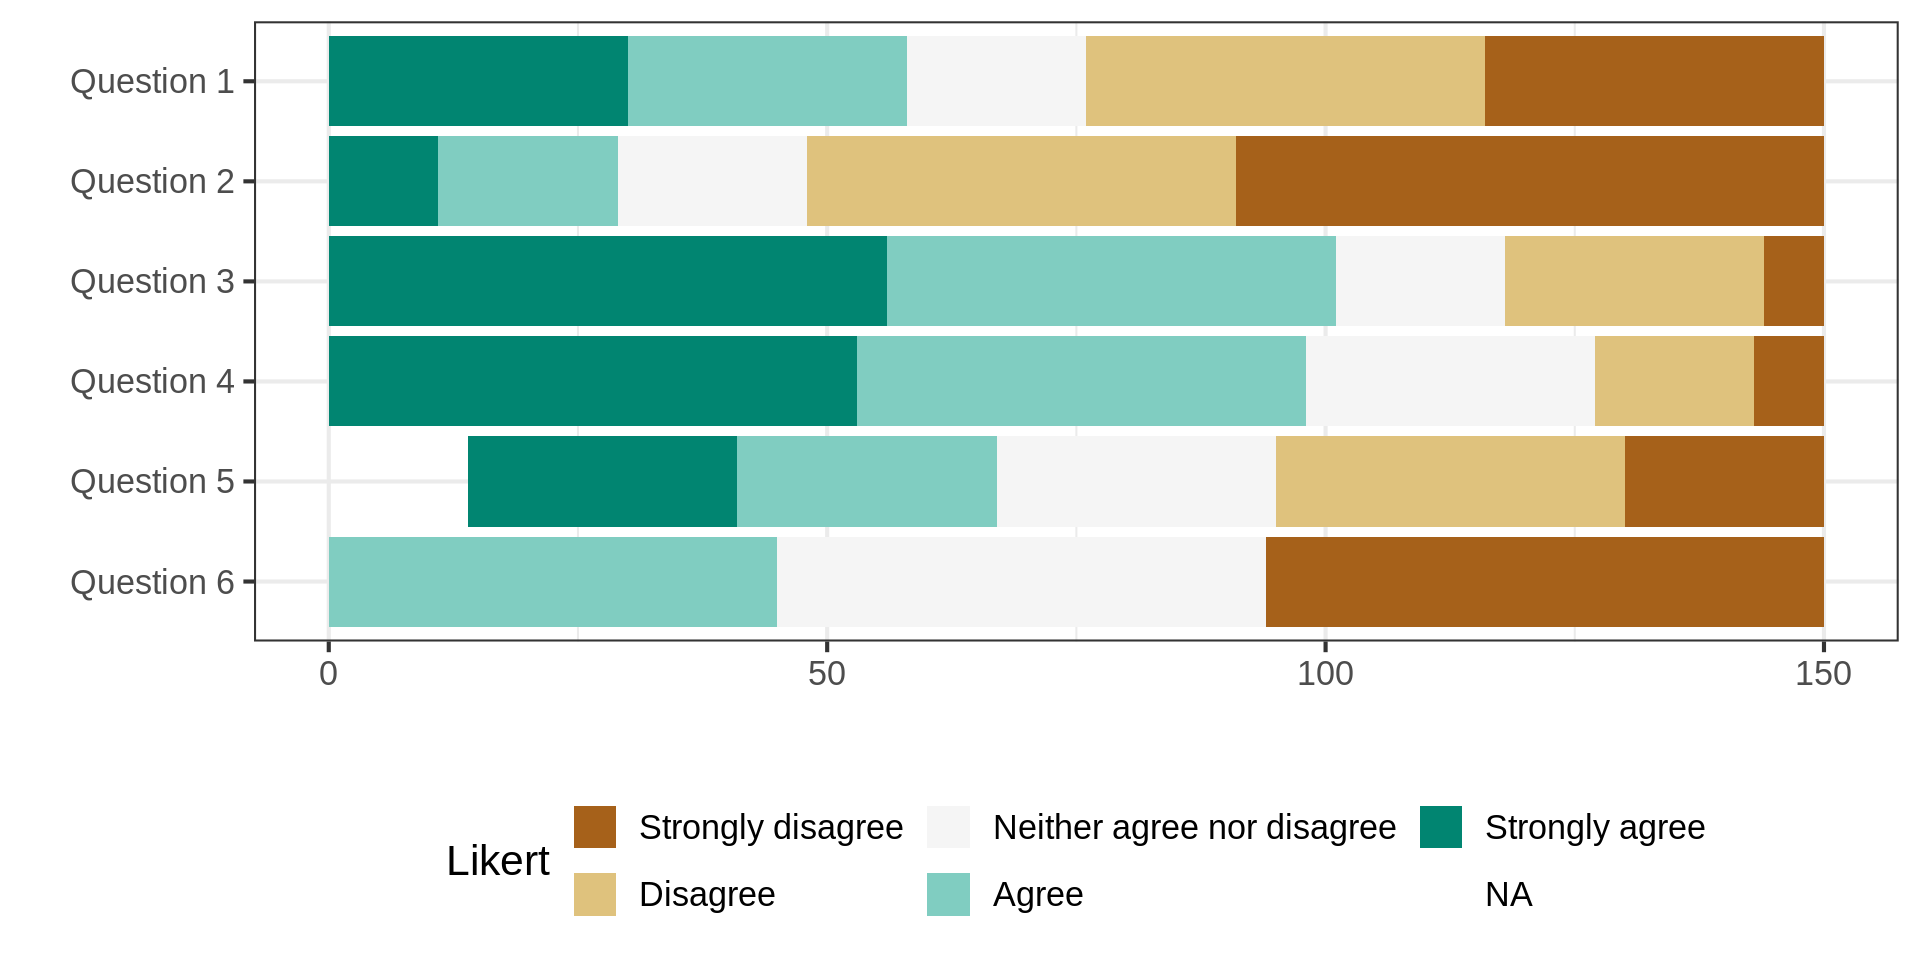
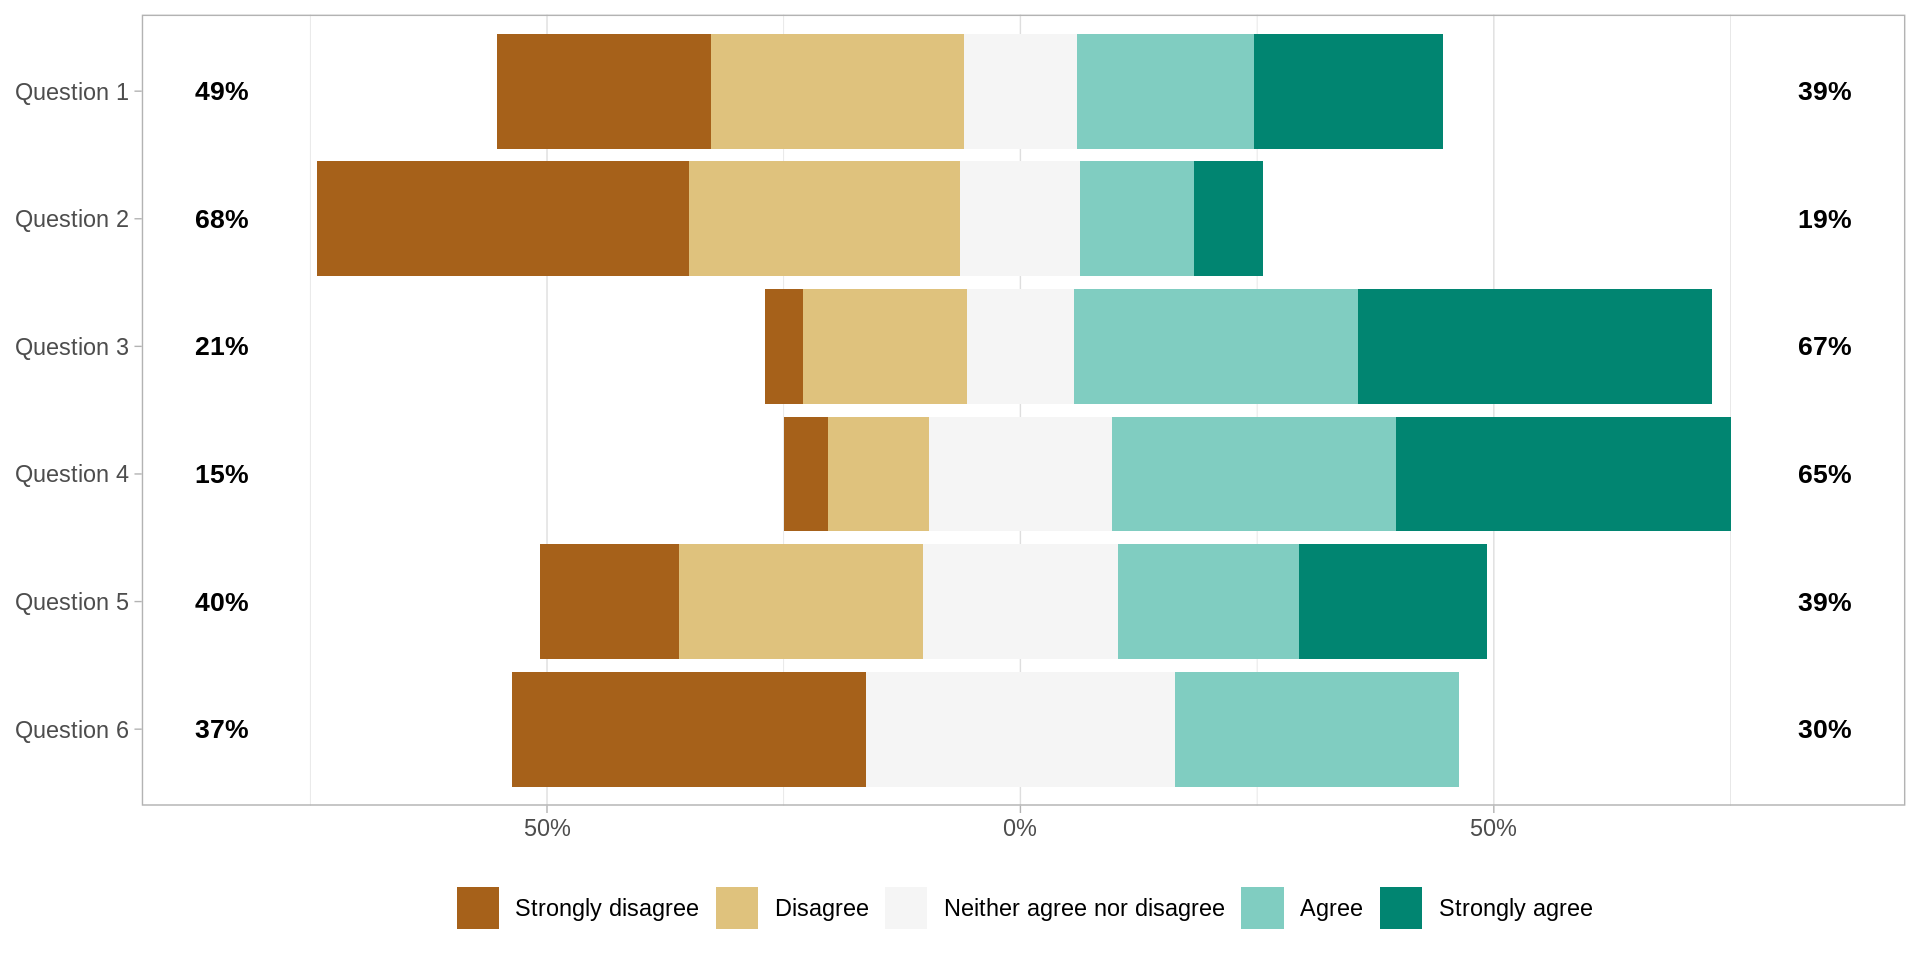
As Likert scale plot
Rational Experiental Inventory data
I enjoy thinking in abstract terms.