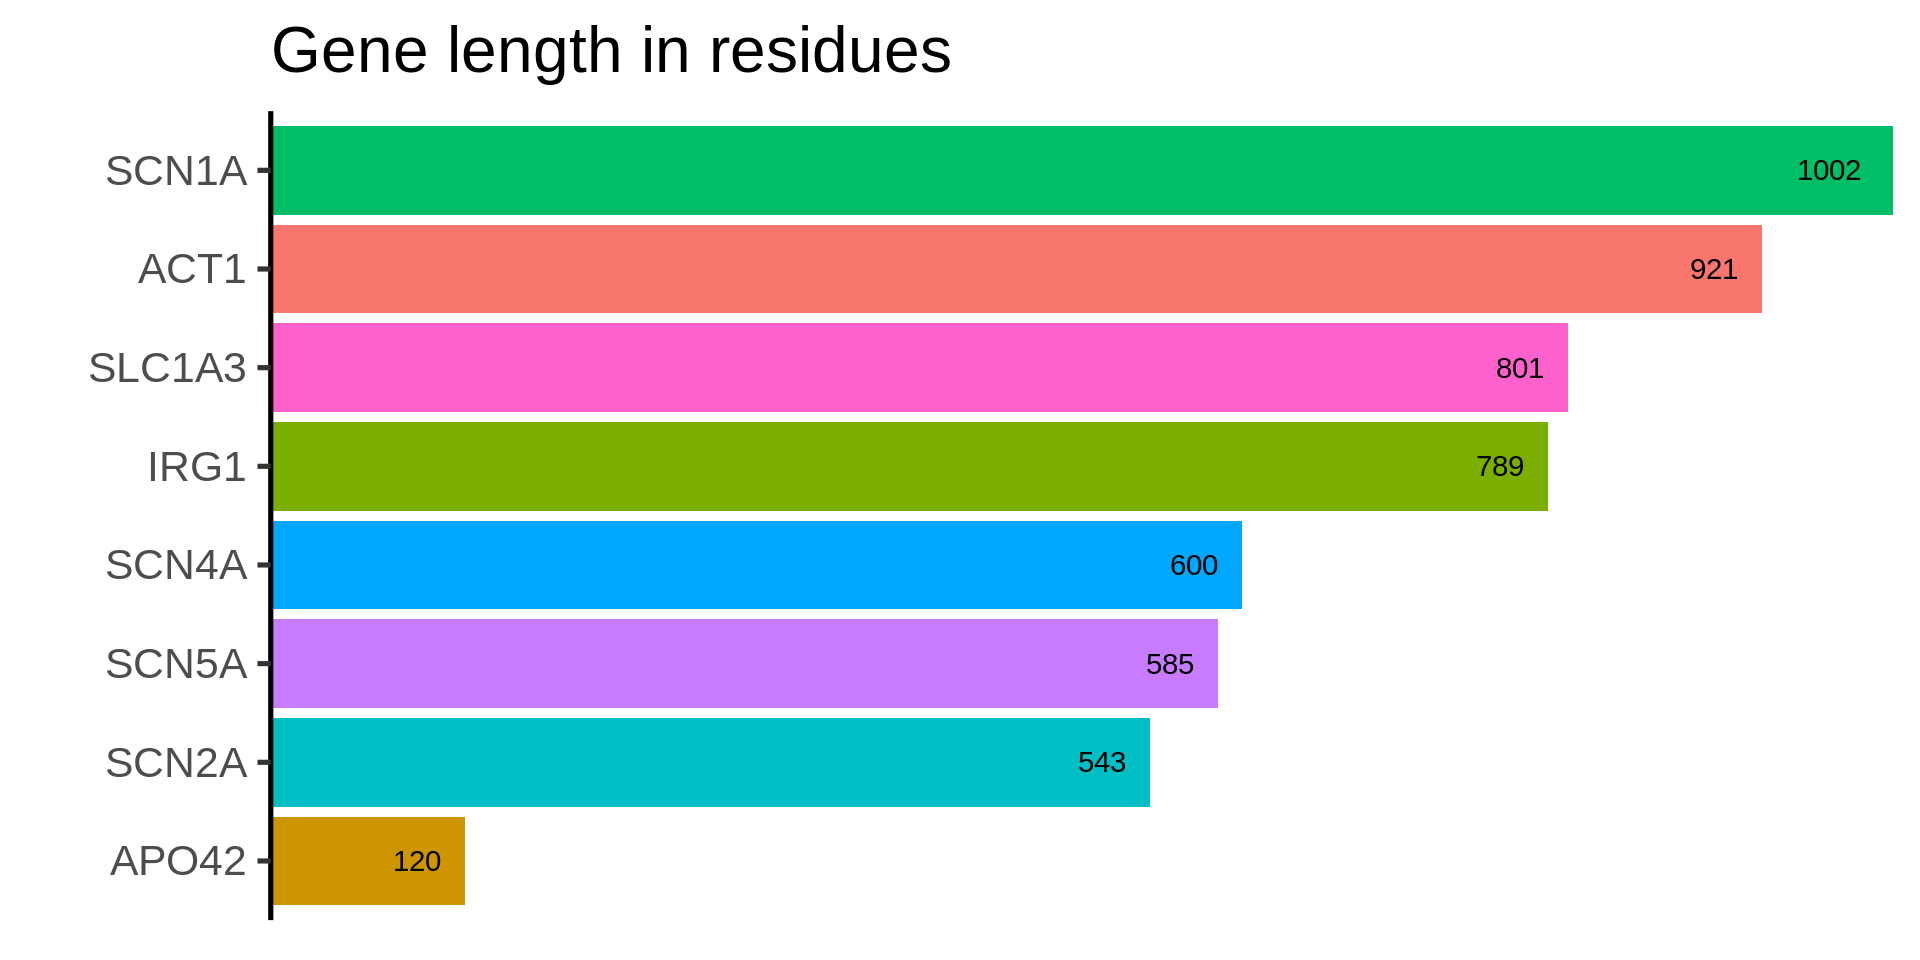
| gene | length |
|---|---|
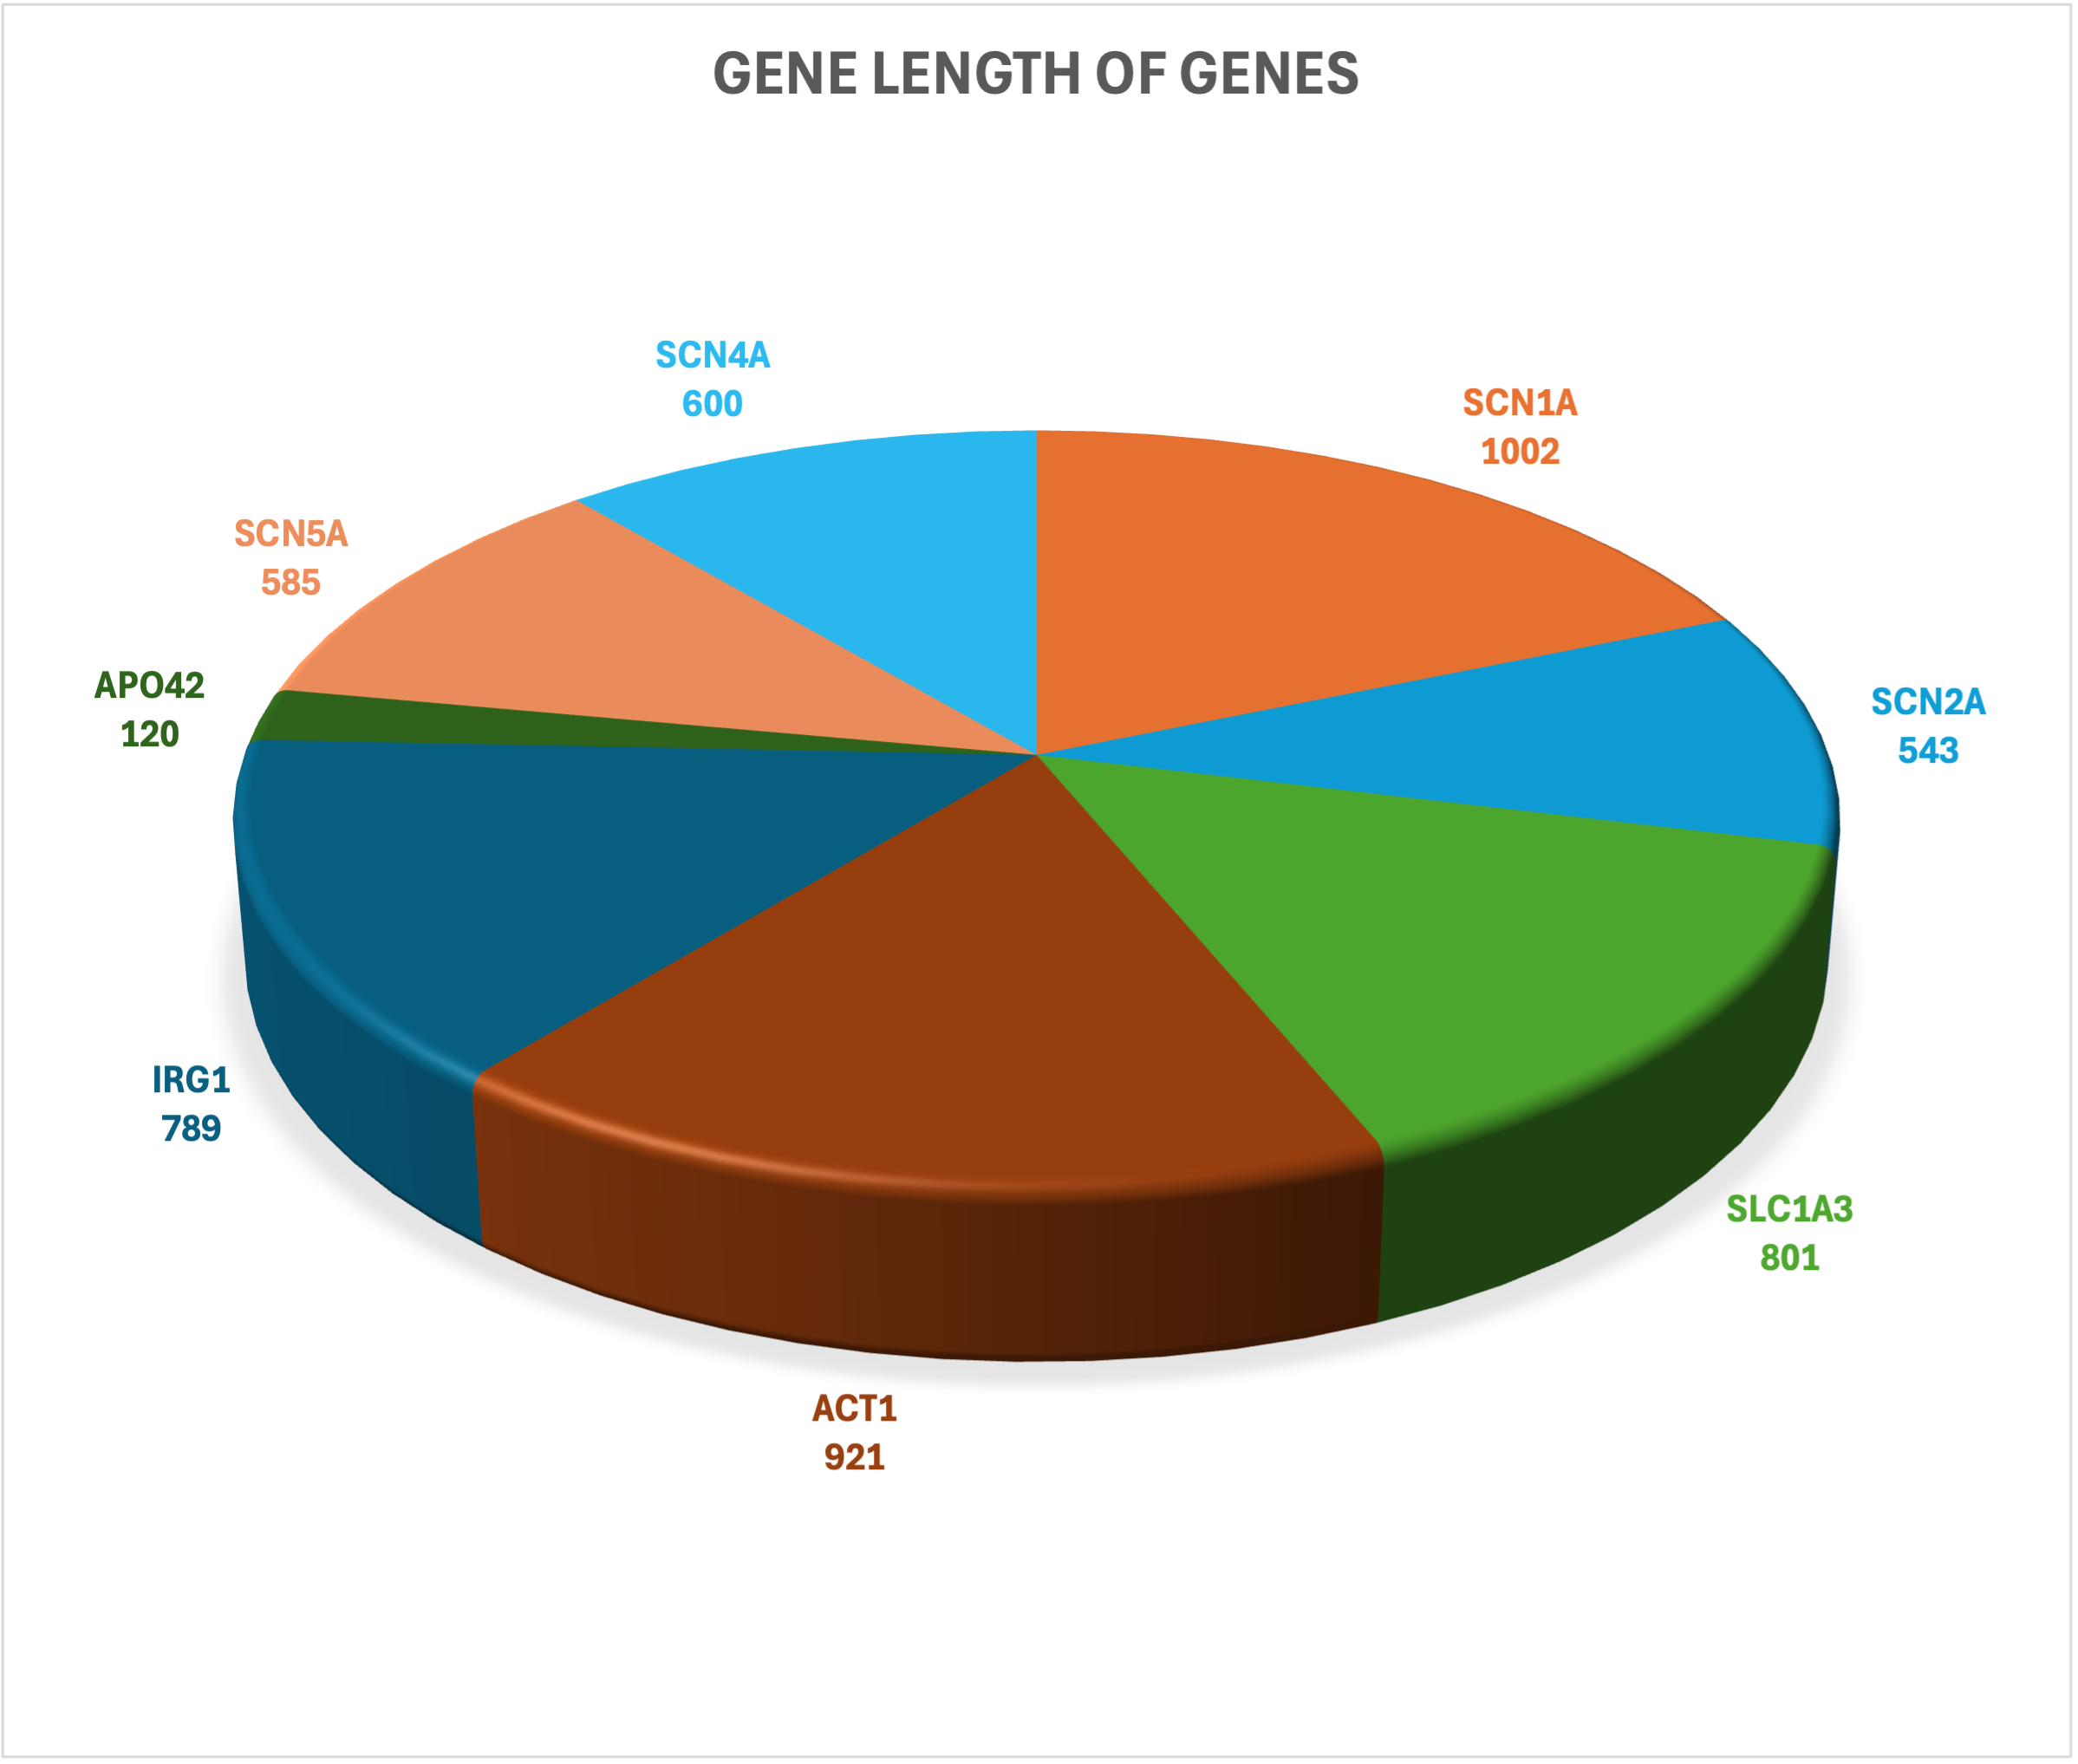
| SCN1A | 1002 |
| ACT1 | 921 |
| SLC1A3 | 801 |
| IRG1 | 789 |
| SCN4A | 600 |
| SCN5A | 585 |
| SCN2A | 543 |
| APO42 | 120 |
Data to ink ratio
Towards production
Wednesday, 18 February 2026
What is good data visualisation?
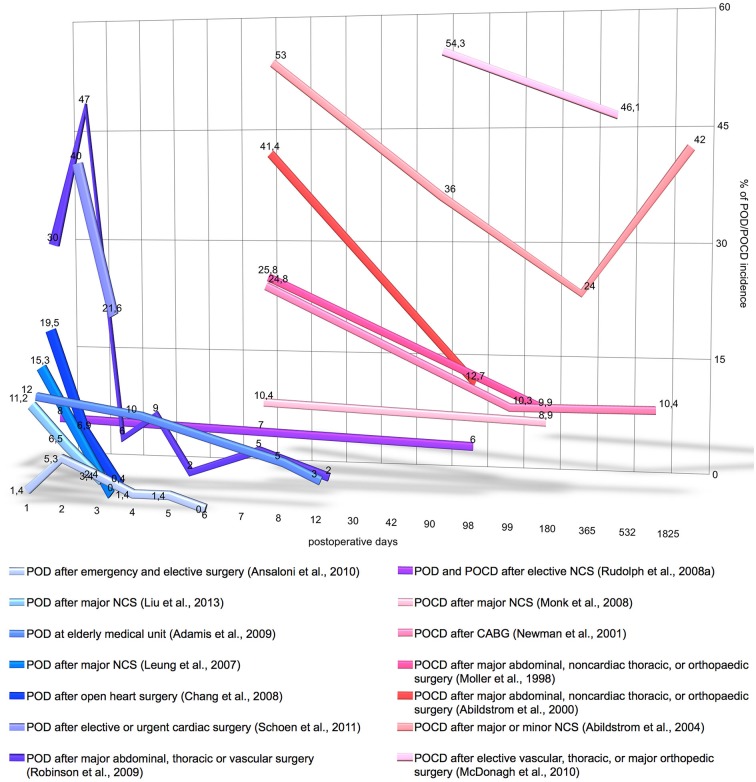
Delirium
Protein complexes
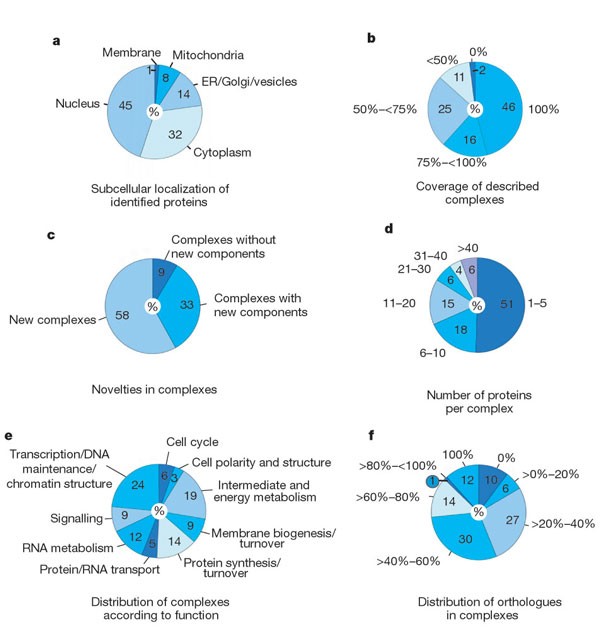
Numbers inside pie charts represent the percentages of total proteins (a) and complexes (b–f). Outer labels show partitioning of the data according to the chart function.
Gavin et al, Nature, 2002


Standard plotting with Excel
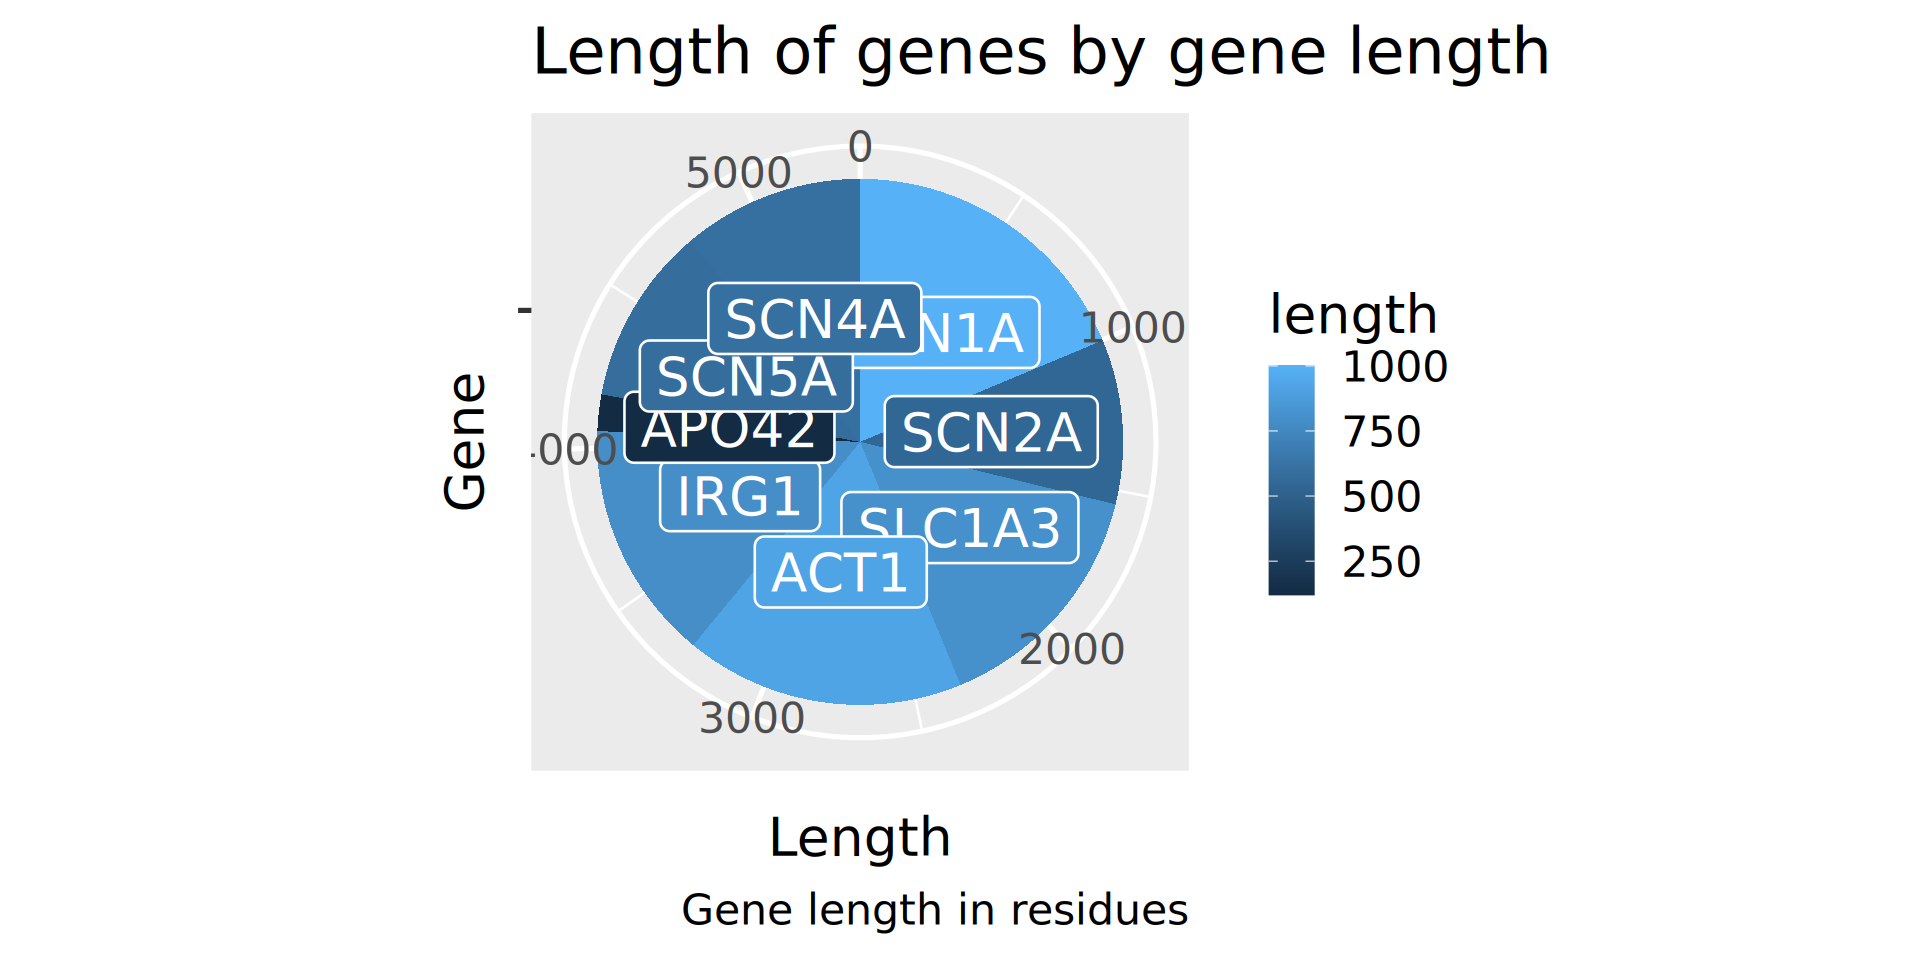
OK, remove 3D
Basic pie chart
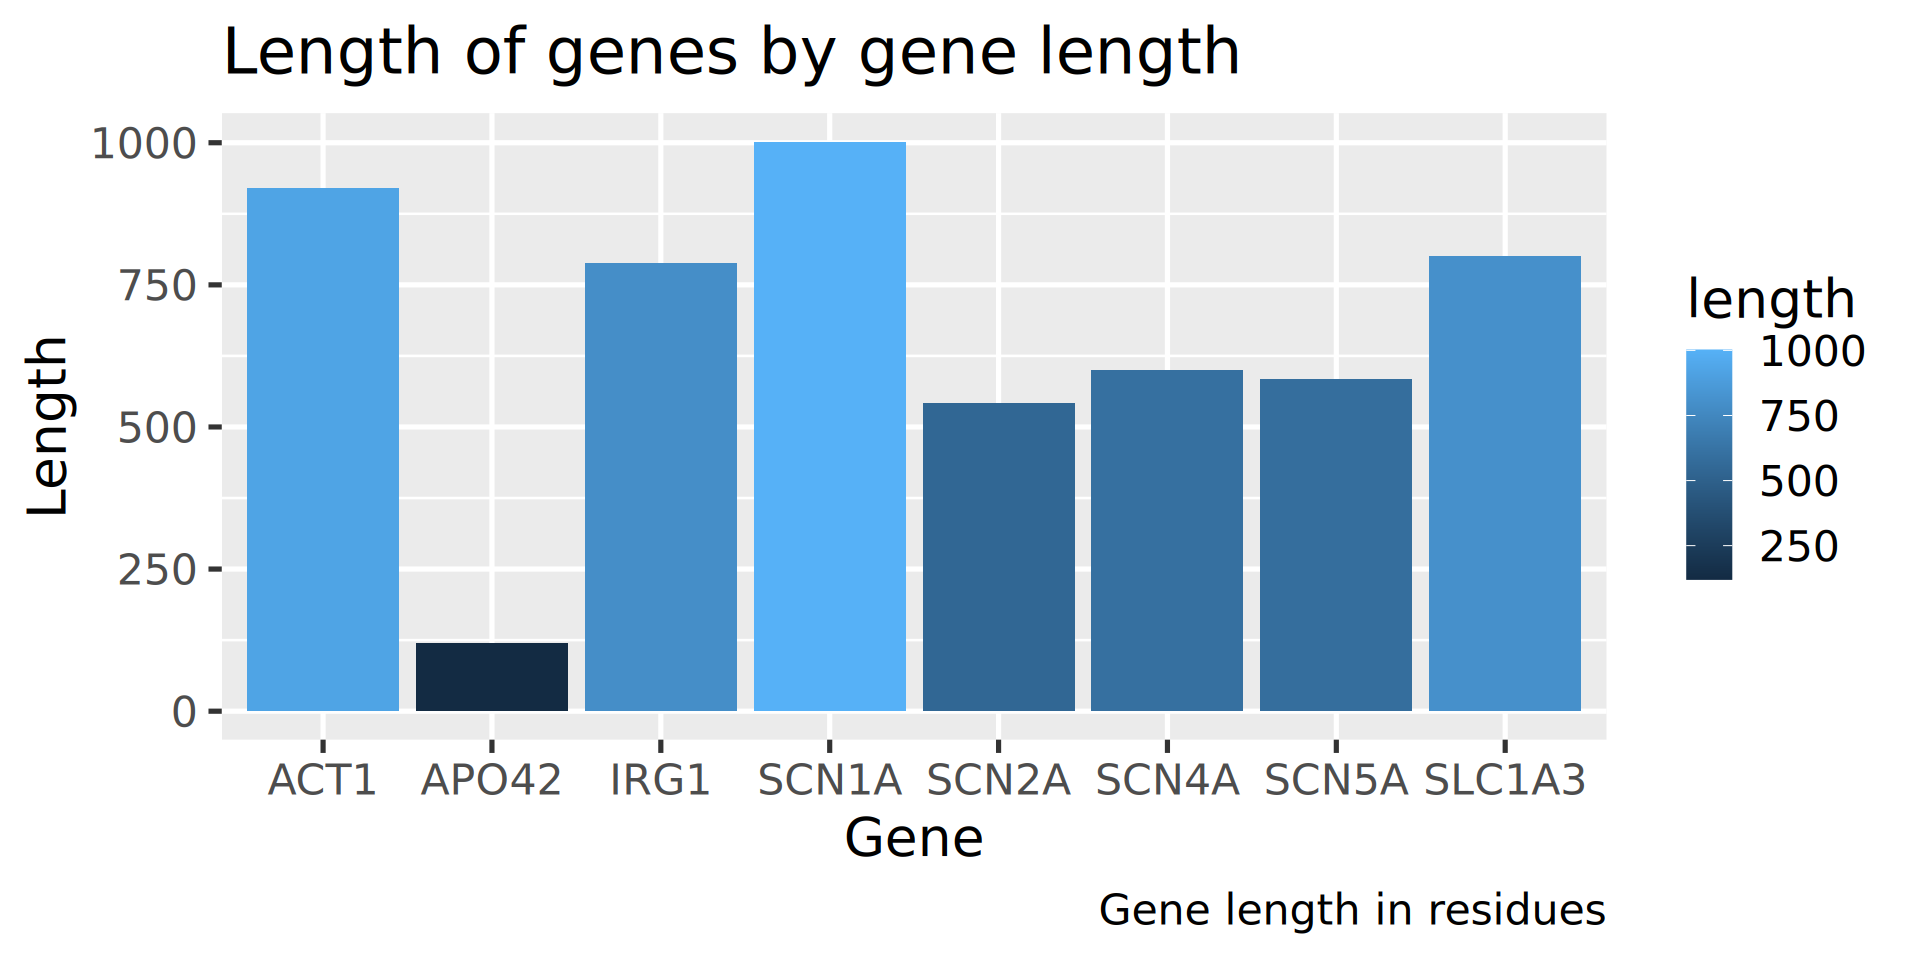
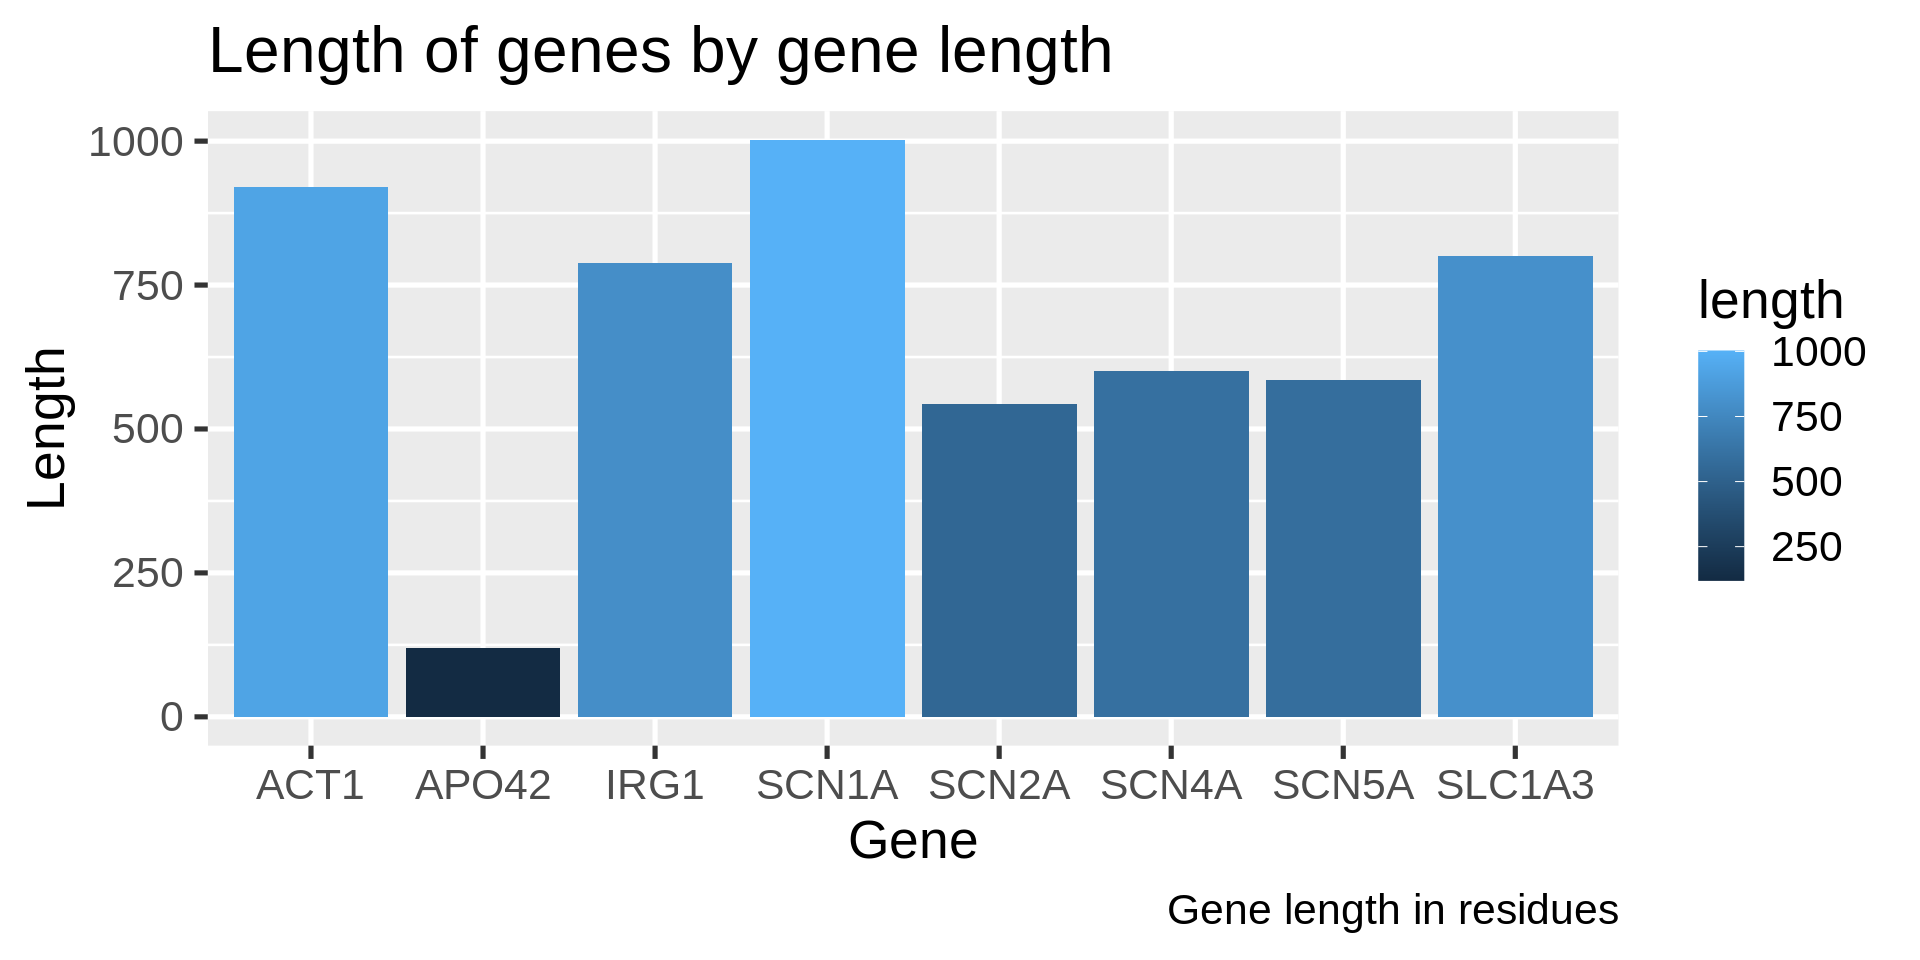
OK, let’s make it a bar chart
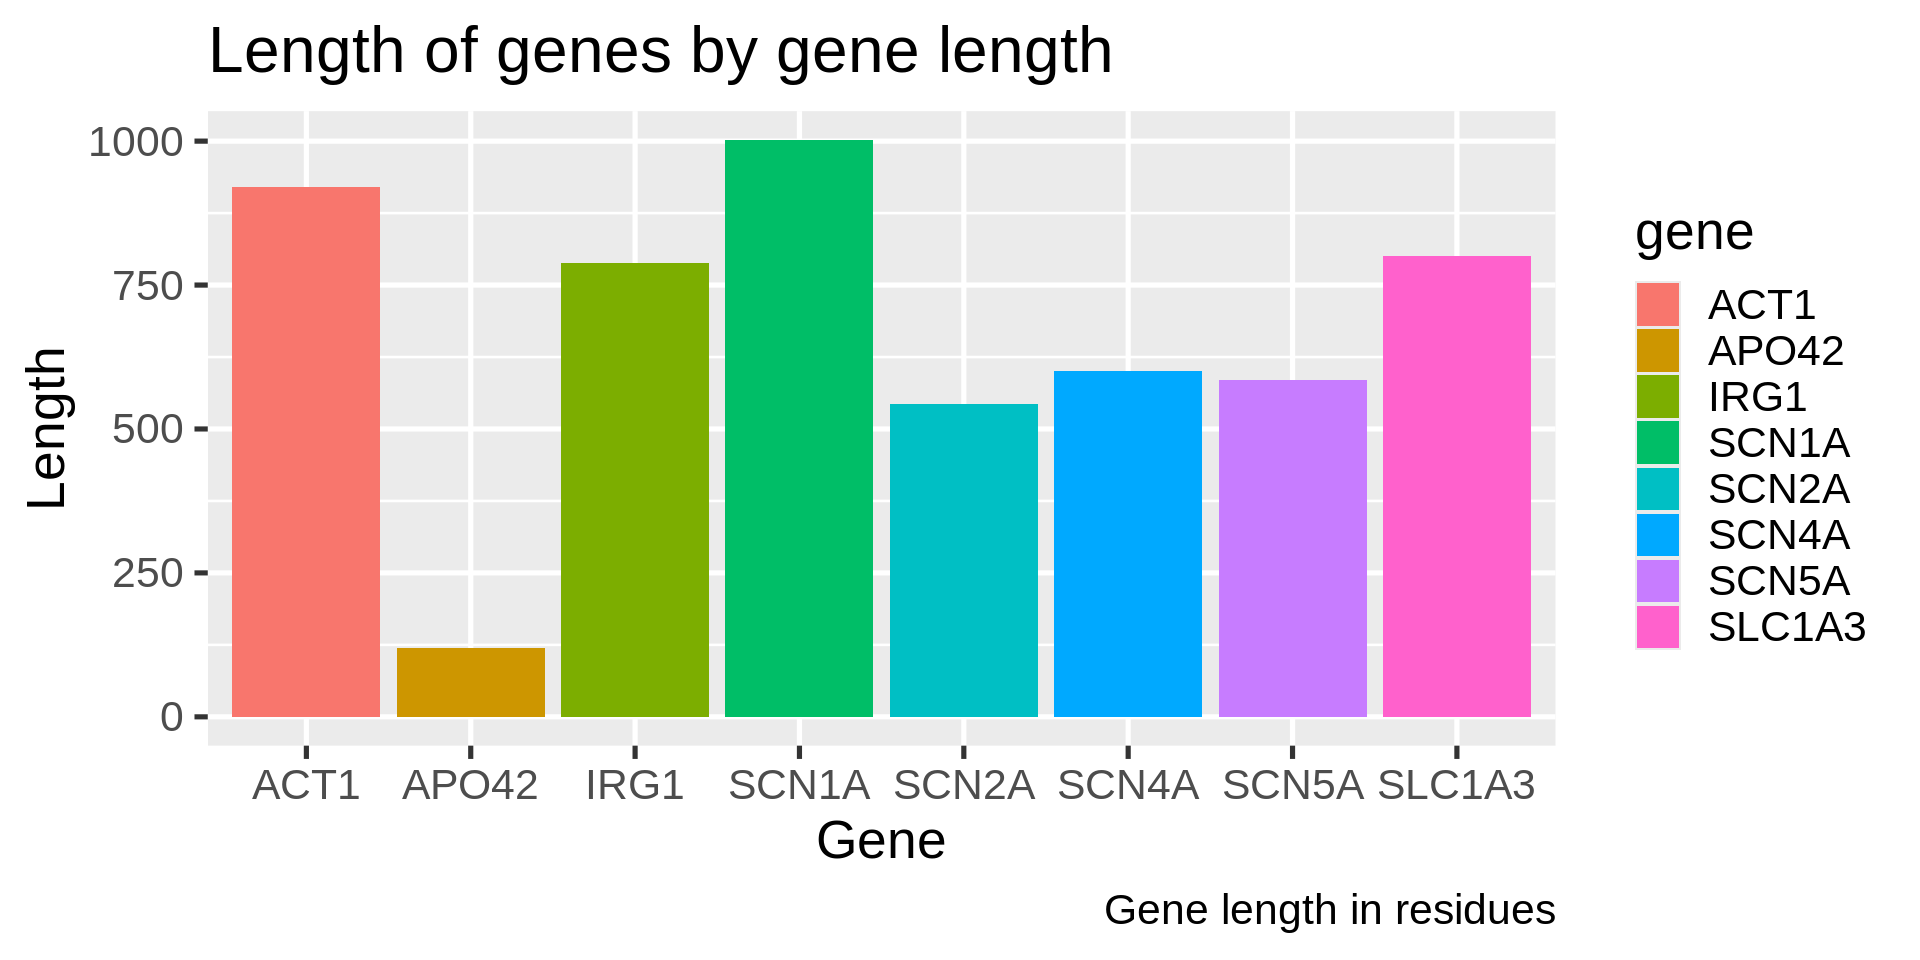
Bar chart
Remove coloring of bars by length, recolor by standard palette
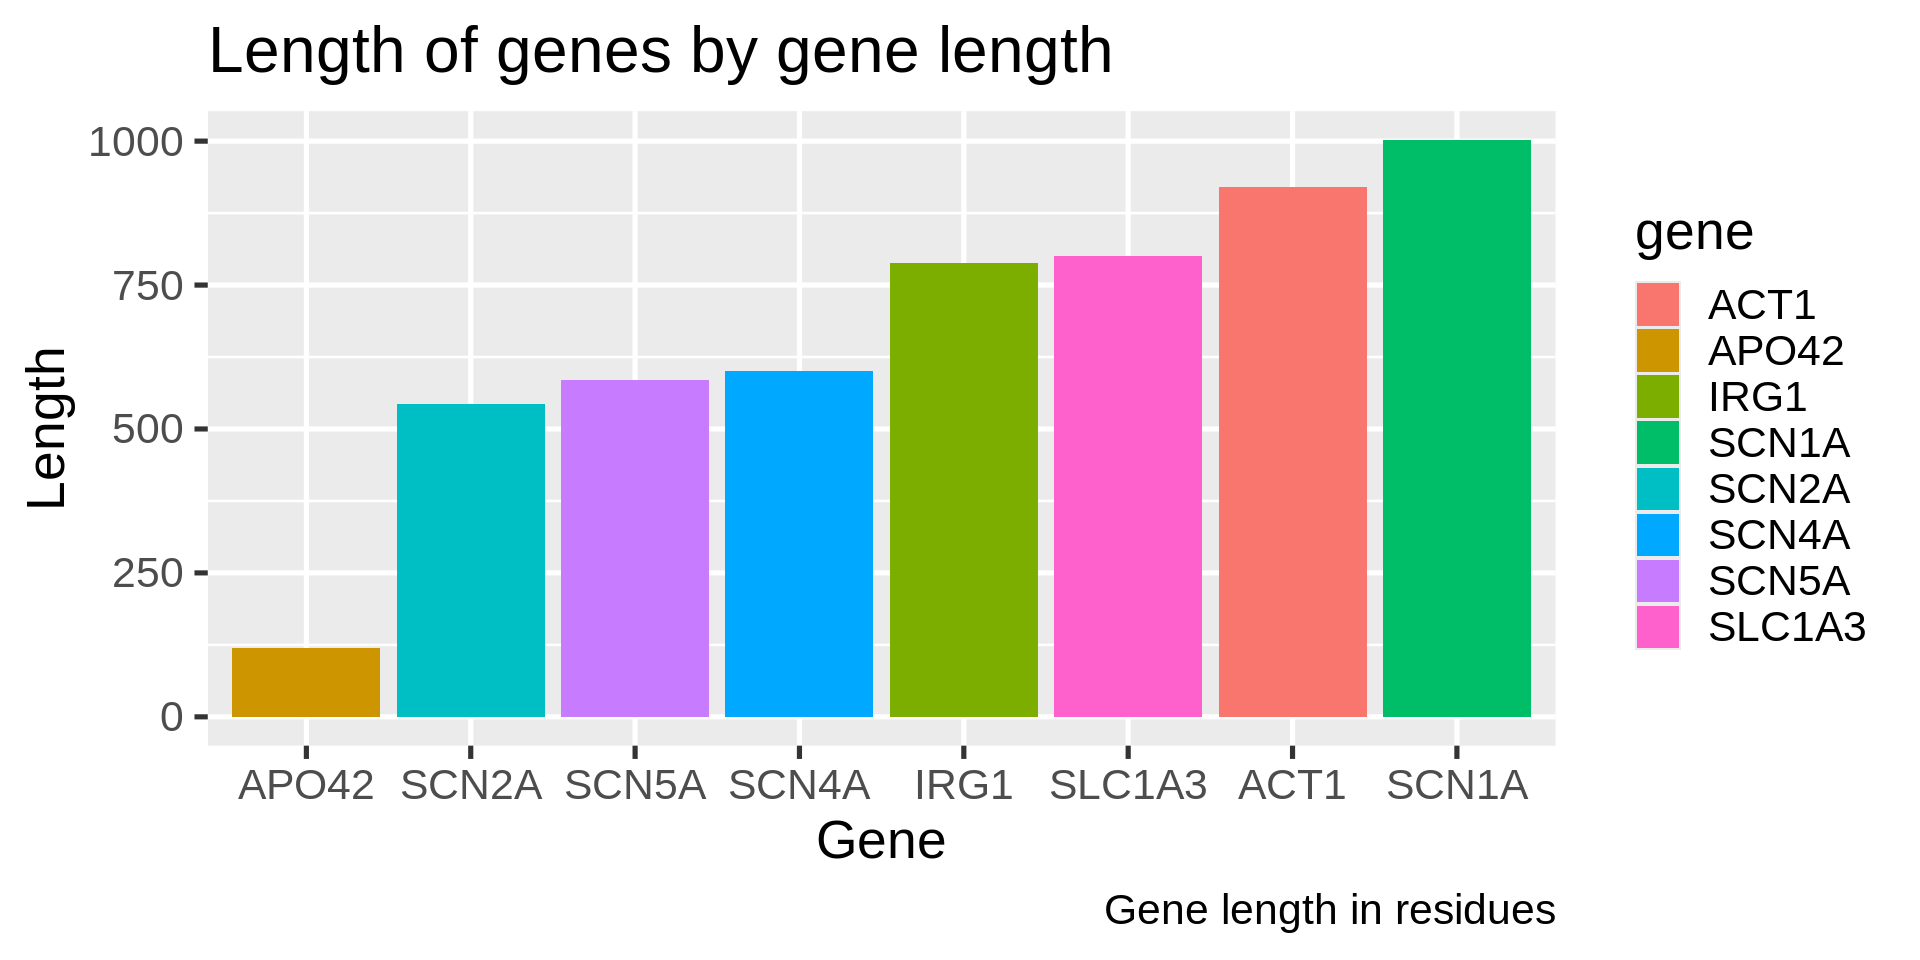
Bar plot with categorical colors
Sort the bars!
Sorted
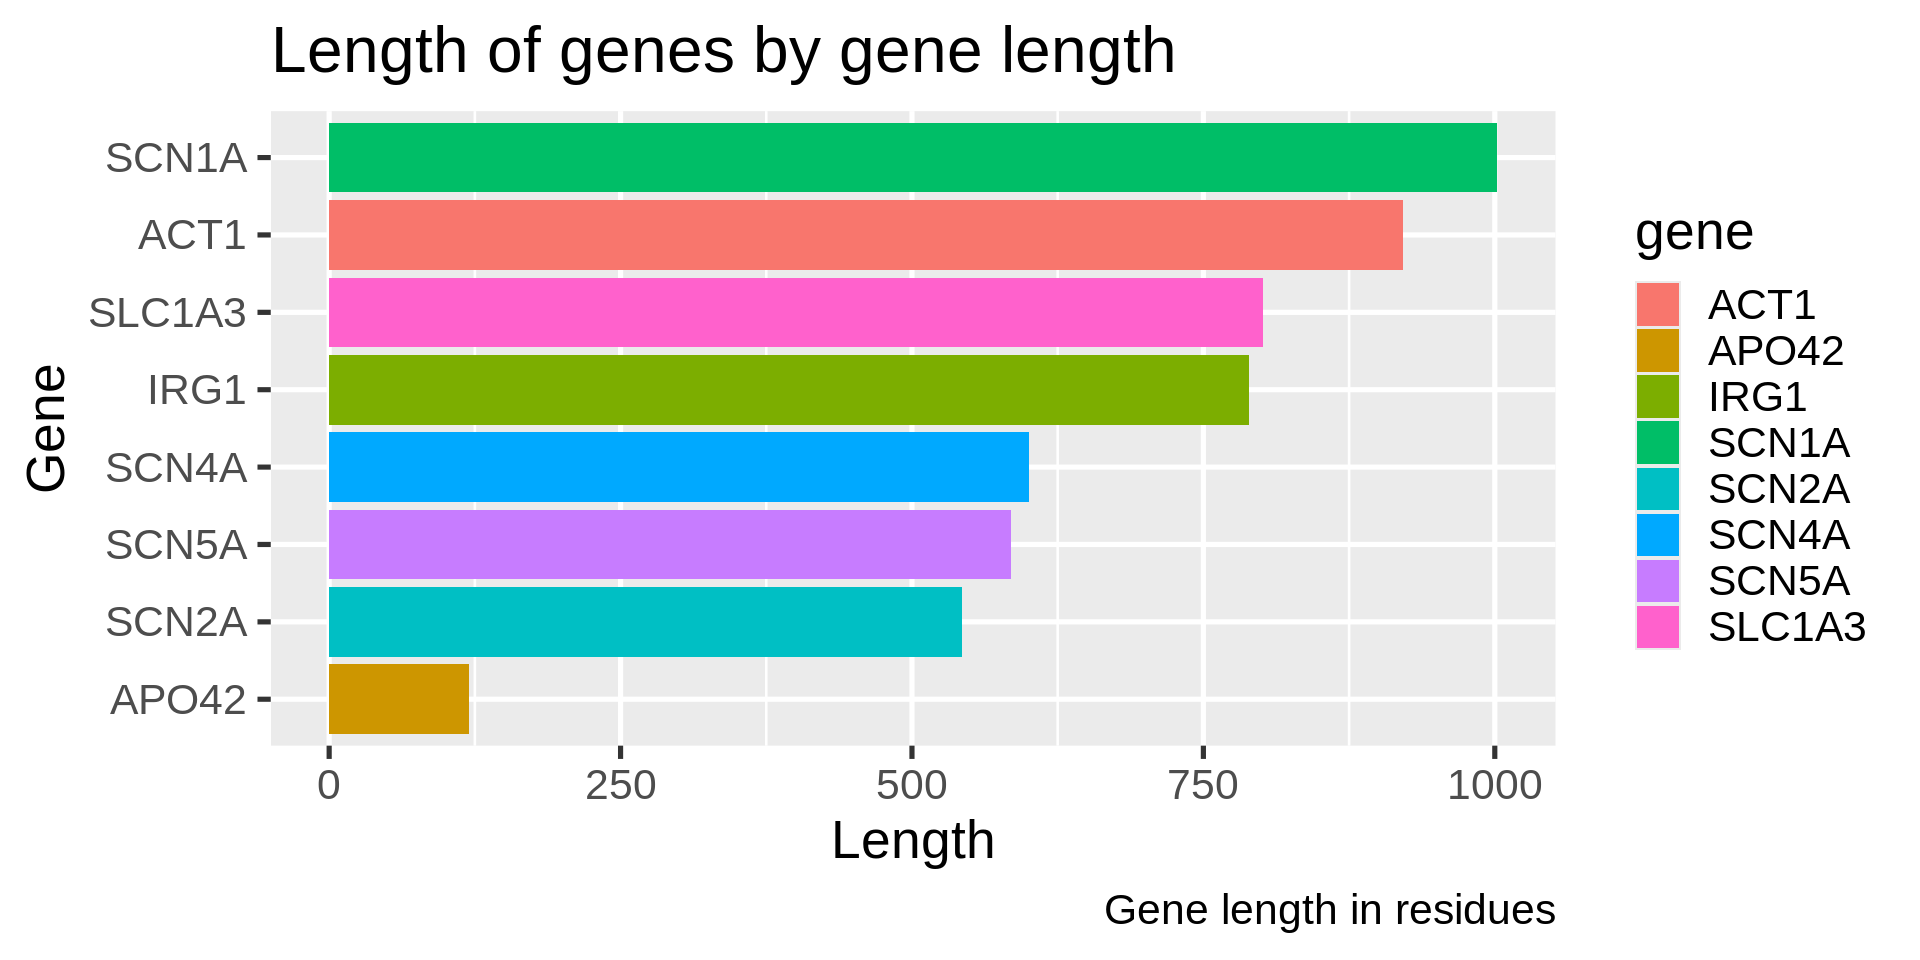
Rotate
The largest on top
Remove the legend - redundant
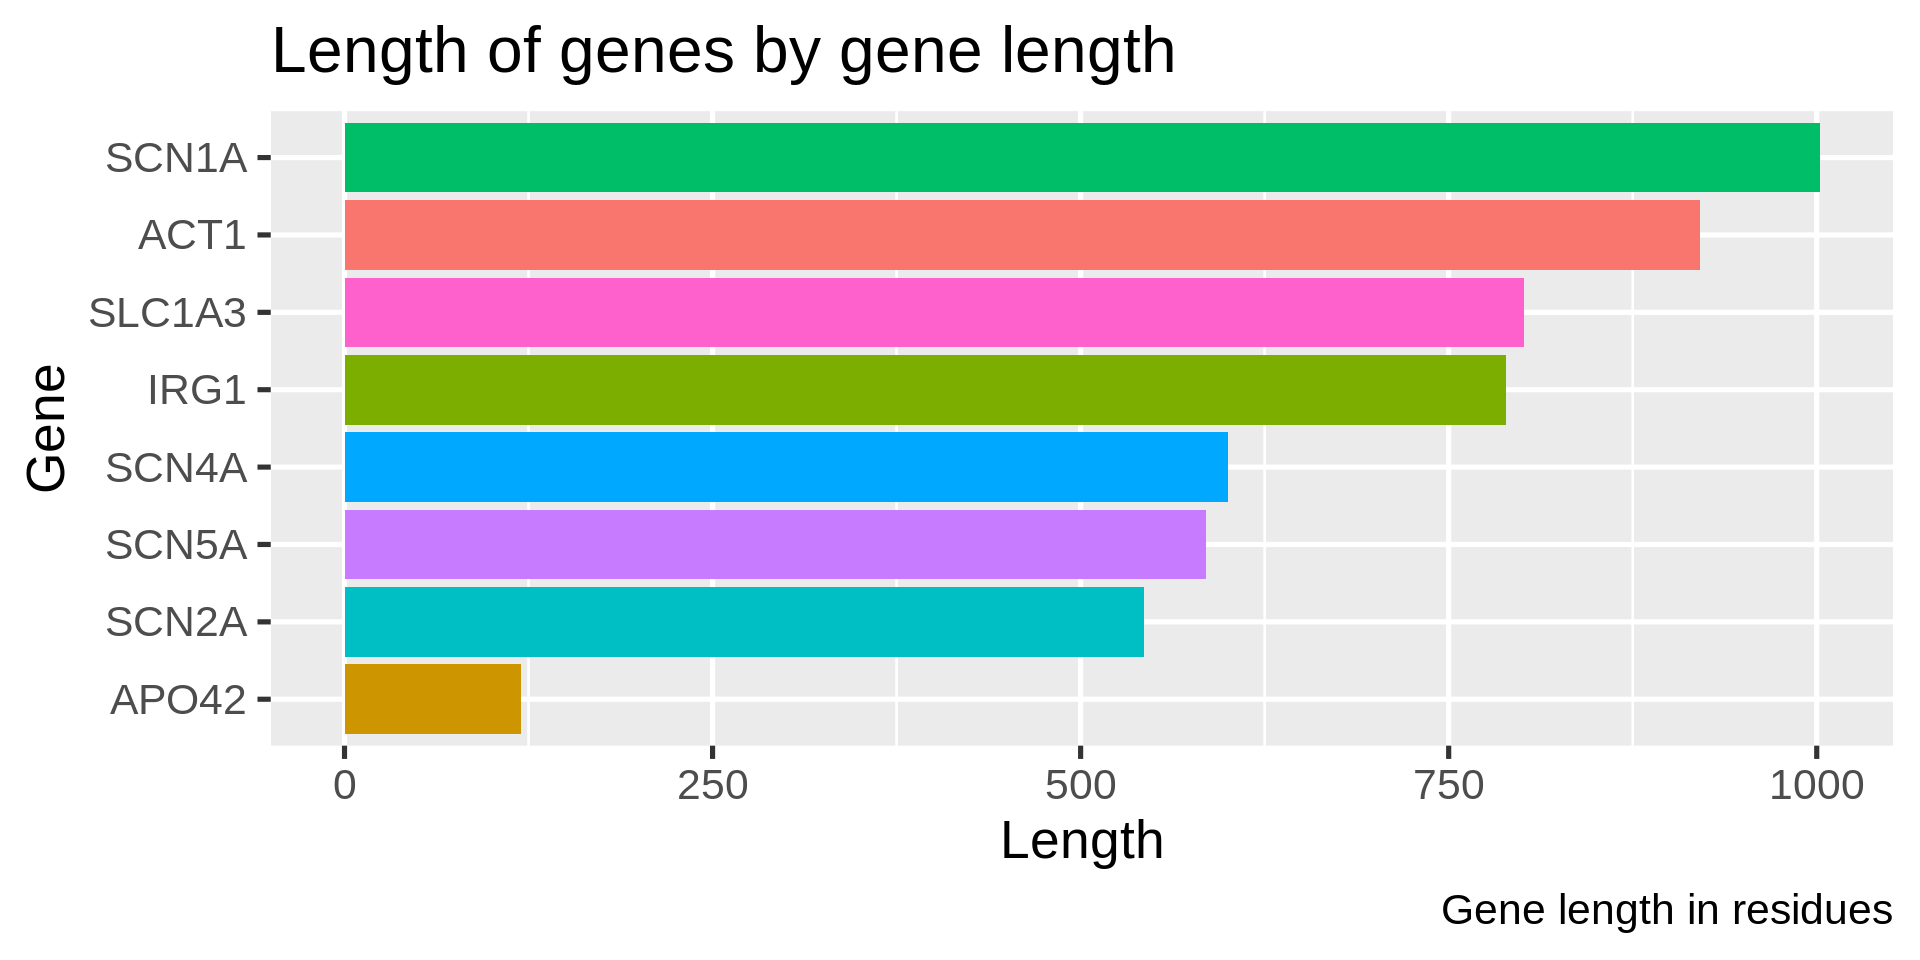
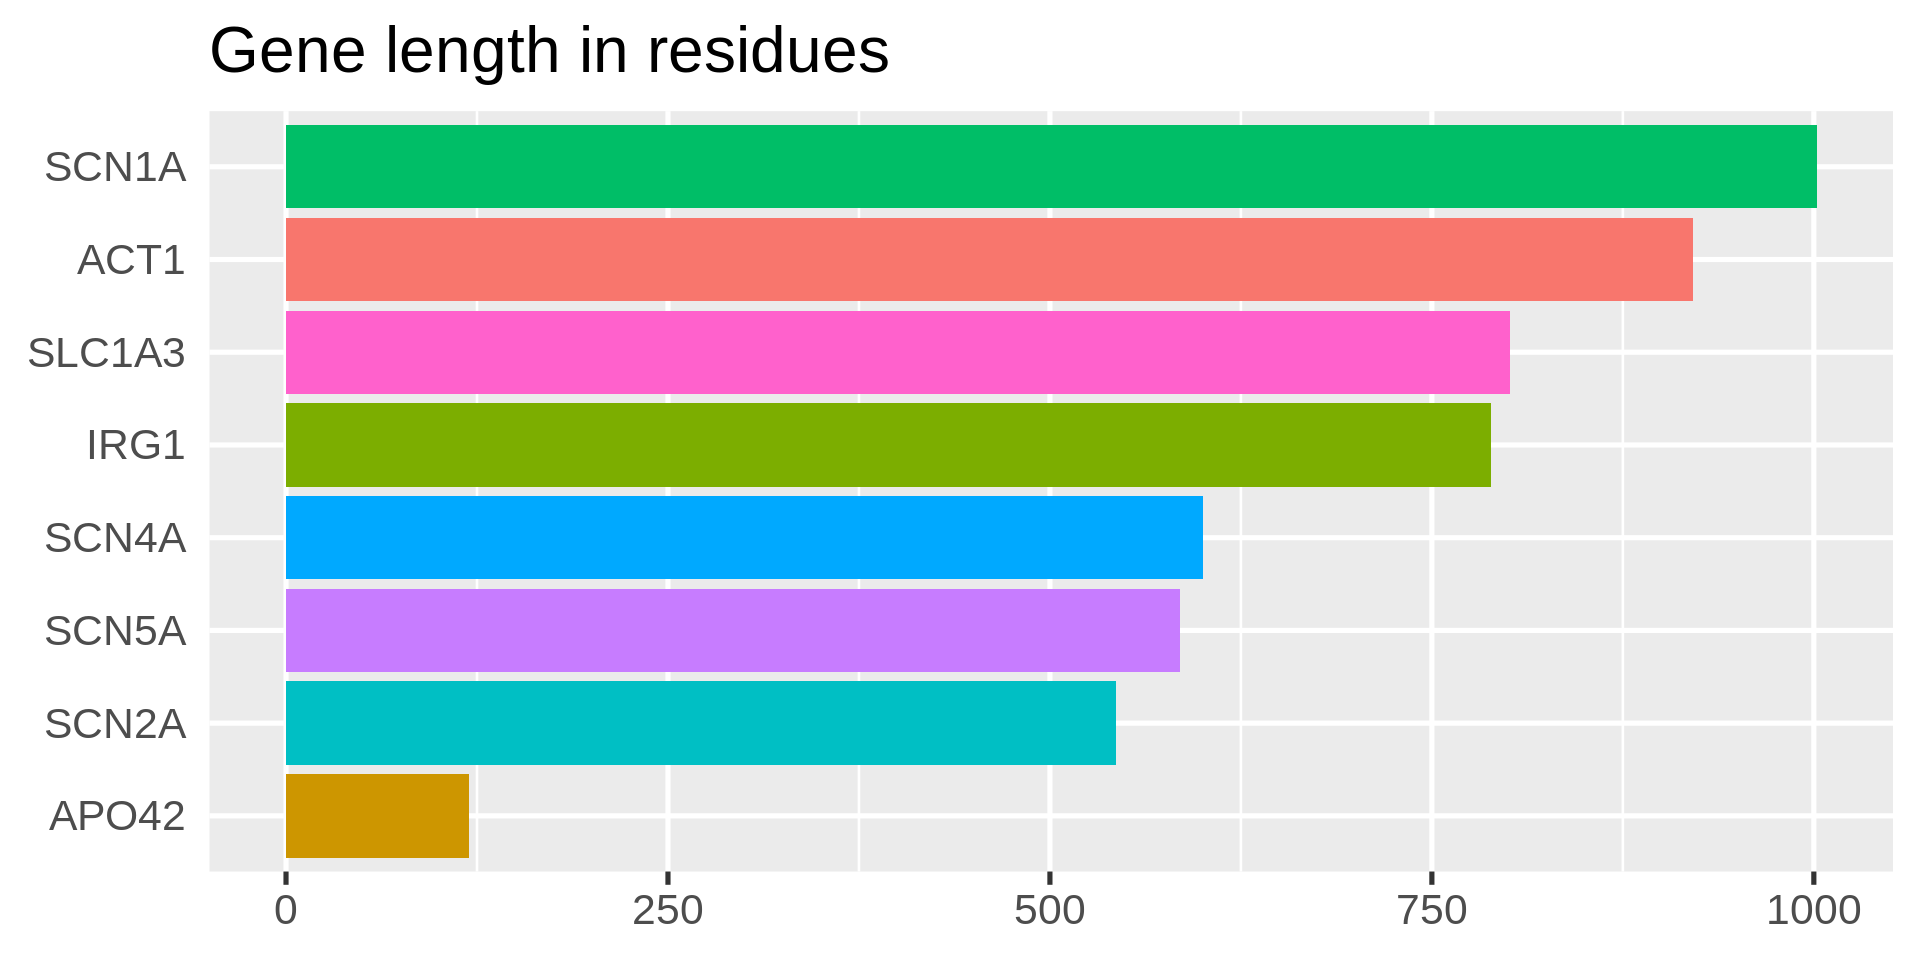
Self-explanatory bar chart
Simplify title and description
New plot title, no surplus legend
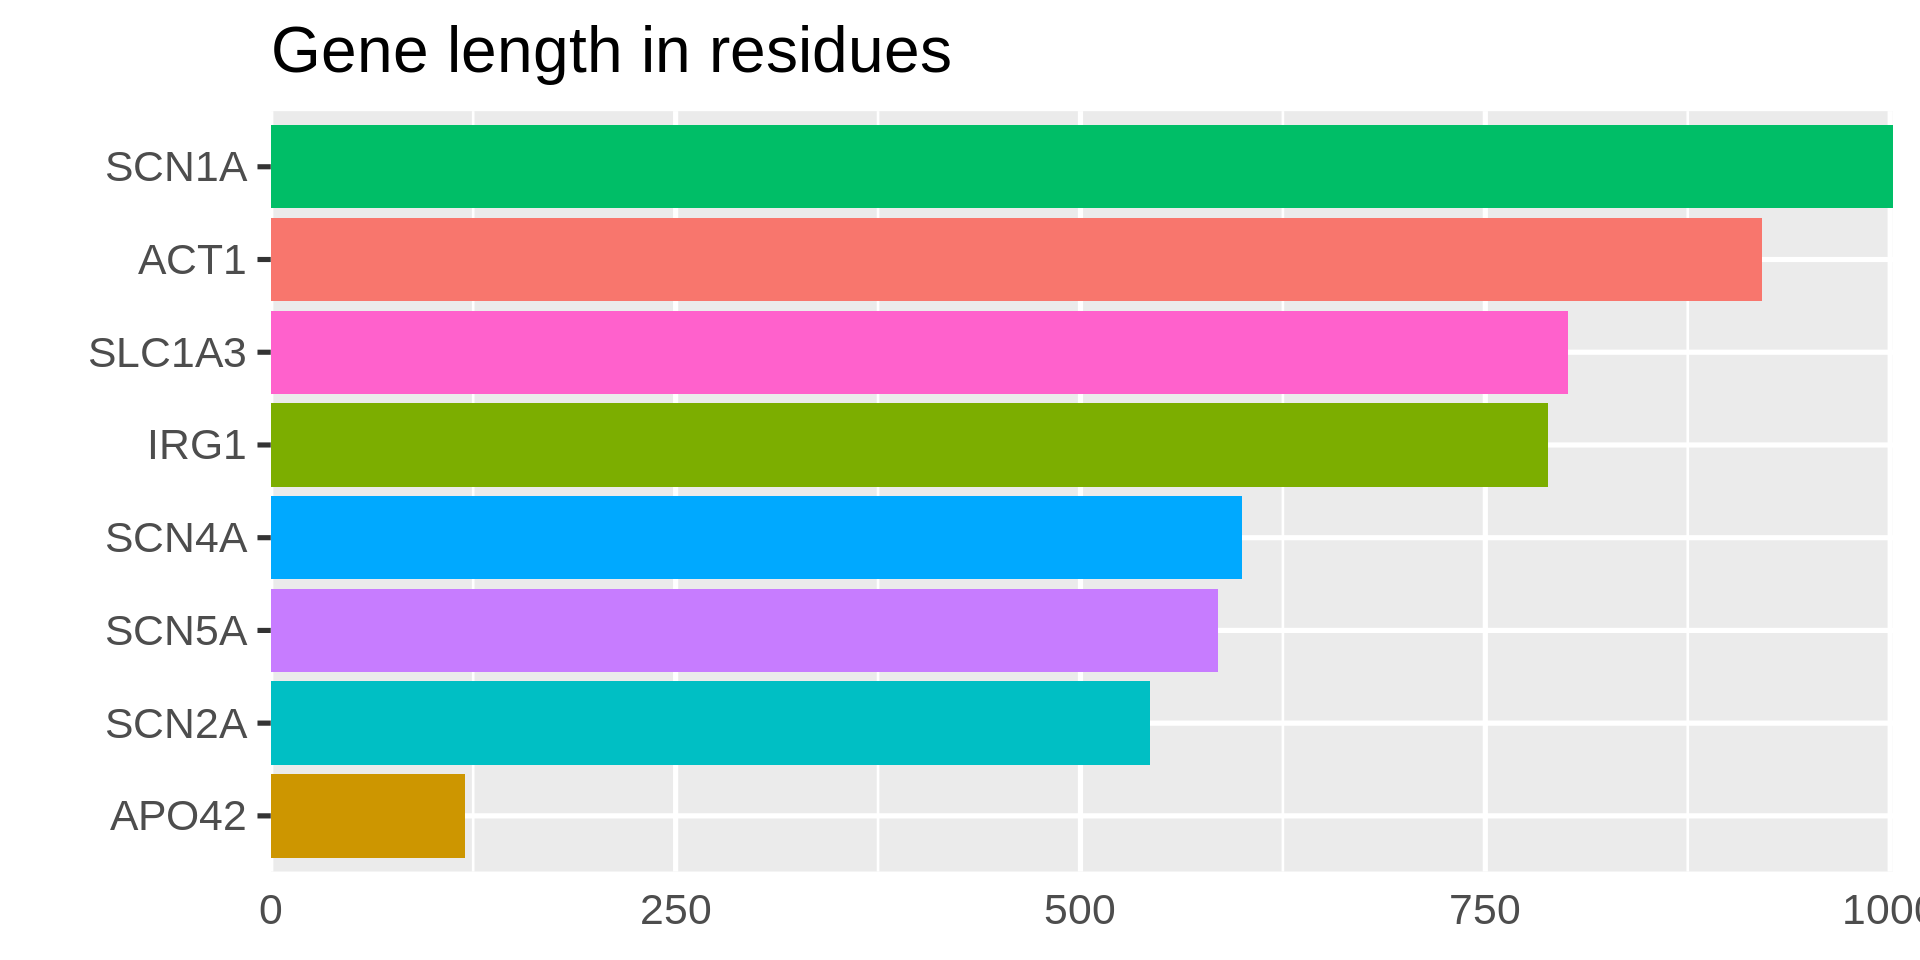
Use the available space
Increase data to ink
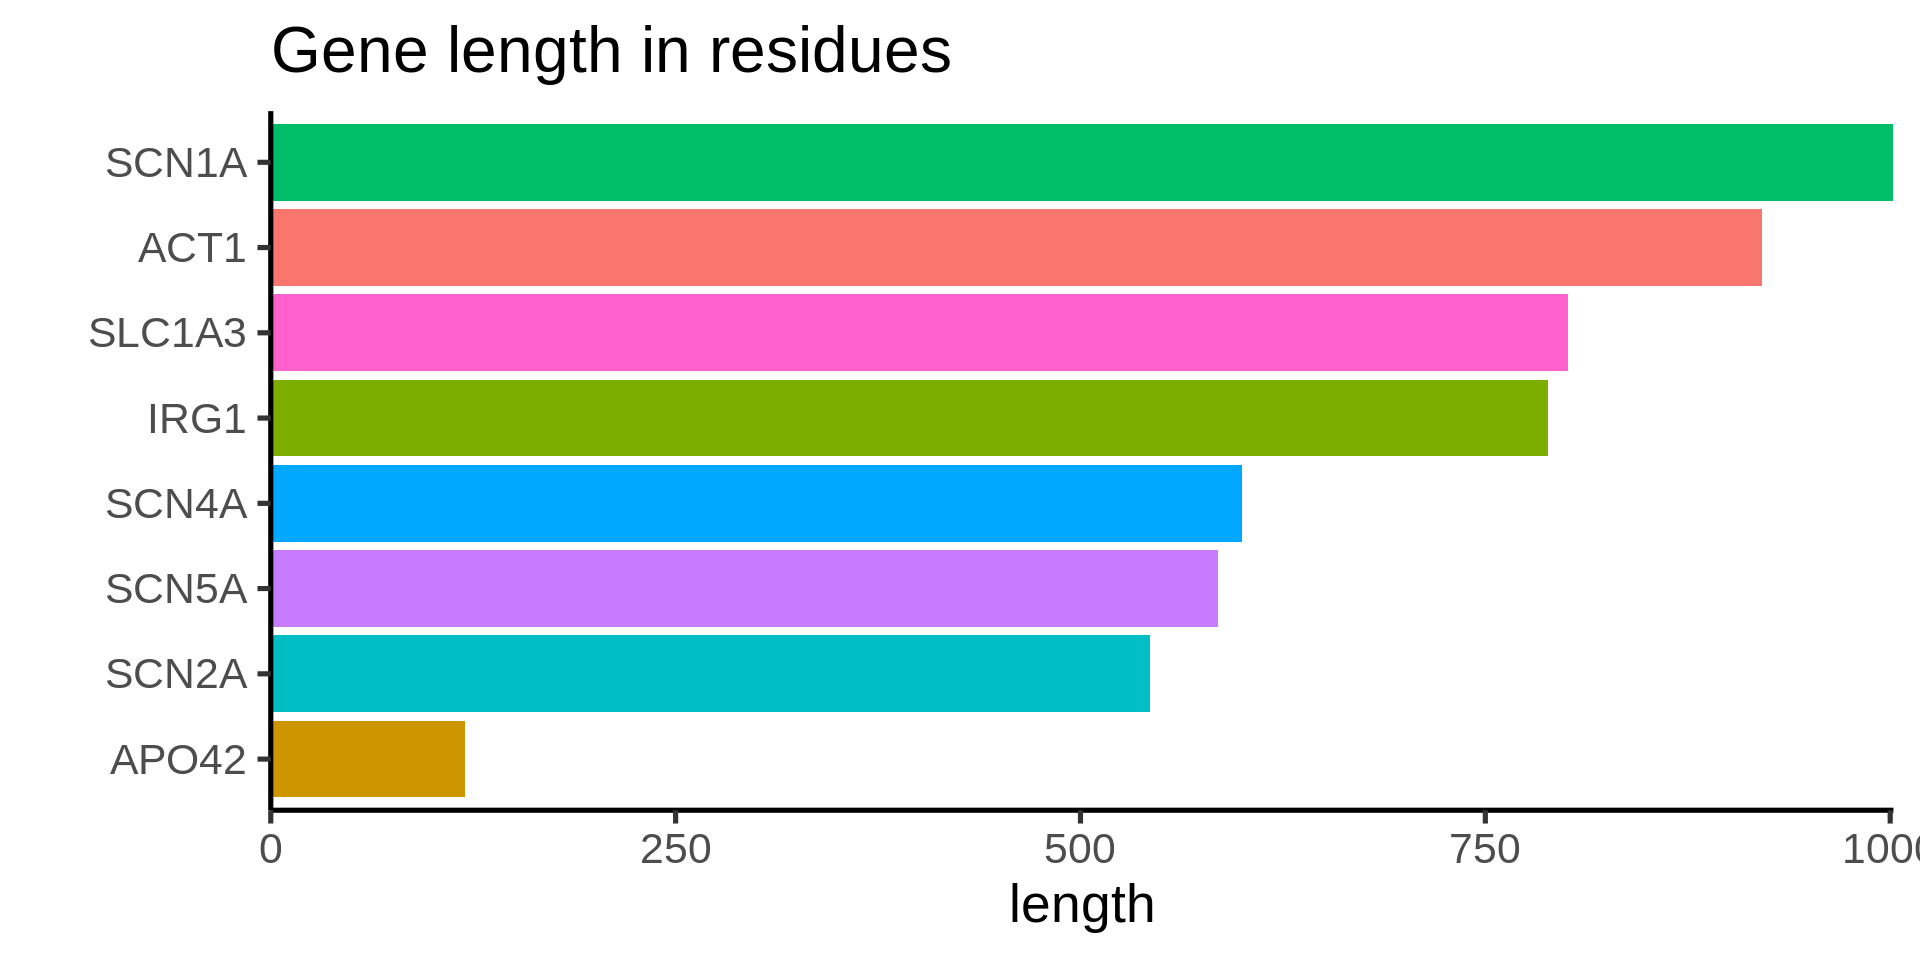
Remove grey background!
White background
Absolute numbers in bars, remove x-axis
Free bars
Remove color
Minimal display